 Nguyen Manh Thang
Chief Executive Officer, AgileTech Vietnam
Nguyen Manh Thang
Chief Executive Officer, AgileTech Vietnam
- Published
- Last updated
- Read time
- 12 min
- Views
- 52
Read the AI overview
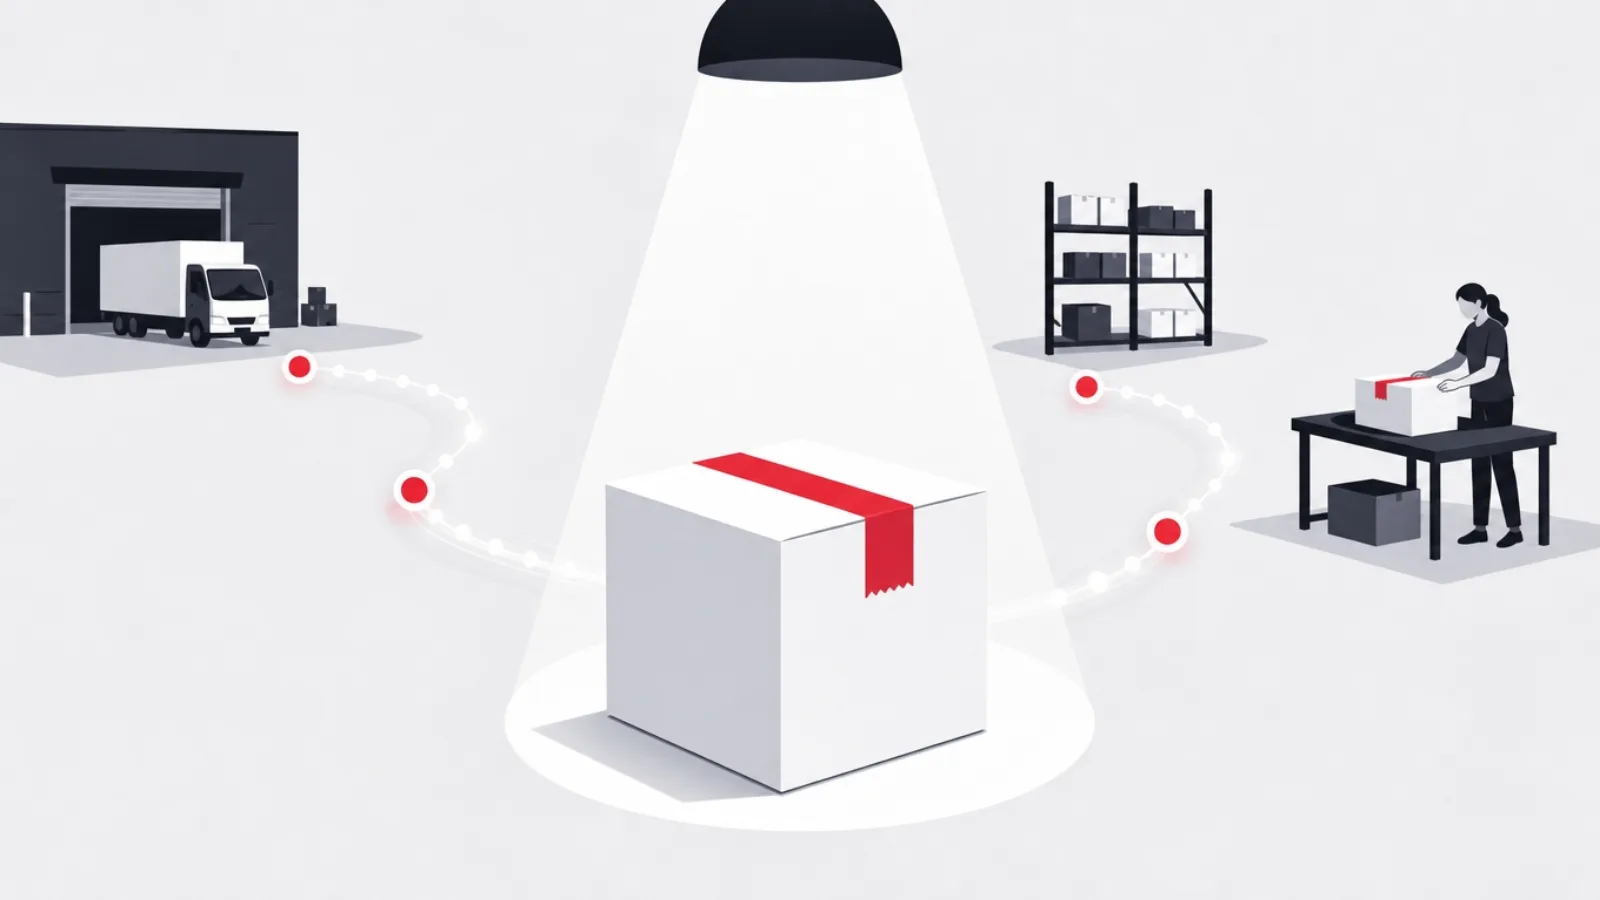
Inventory management software is a system that keeps a live, trustworthy record of what stock a business owns, where it sits, and what is already promised to customers, and updates that record automatically as goods are received, moved, sold and returned. At its core is a perpetual stock ledger: every barcode scan, order and adjustment writes a transaction, so quantities are computed facts rather than periodic guesses. Around that core sit reordering logic, multi-location tracking, and integrations with sales channels, accounting and shipping. It replaces spreadsheets when stock lives in more than one place, sells through more than one channel, or moves too fast for manual counts to stay true.
Every business that holds stock answers the same three questions hundreds of times a week: what do we have, where is it, and can we promise it to this customer? Inventory management software exists because past a certain size, human memory and spreadsheets answer those questions wrongly often enough to cost real money, in stockouts, oversells, dead stock and hours of counting.
This guide explains the software from first principles: the data model at its core, the mechanics of how a barcode scan becomes an updated quantity, what the system connects to and why those connections carry half the value, and what the honest boundaries are, where a spreadsheet is genuinely fine, where SaaS tools win, and where operations are unusual enough that custom software enters the conversation.
It is written to pair with two companion pieces: our feature-by-feature buyer's guide for teams already evaluating tools, and our deeper operational guide on tiers, accuracy programs and reorder policy. This one stays on the definitional question, what the software is and how it actually works, because getting that model right makes every later decision easier.
Key takeaways
- The heart of every inventory system is a perpetual ledger, not a list: quantities are computed from an append-only history of transactions, which is why good systems can tell you not just what you have but how it got that way.
- The software distinguishes quantities a spreadsheet collapses: on hand, committed, available to promise, on order and in transit are different numbers, and most stockouts and oversells come from conflating them.
- Real-time accuracy comes from capturing events at the moment they happen, scans at receiving, picks at the shelf, sales at the channel, not from counting harder after the fact.
- Integrations are half the product: connections to sales channels, accounting, purchasing and shipping are what turn a stock record into an operating system for the business.
- The spreadsheet boundary is structural, not a matter of discipline: one location, one channel and slow turnover suit a spreadsheet fine, and crossing any of those thresholds is when software stops being optional.
- Costs range from tens of dollars a month for small-business SaaS to custom builds for operations with genuinely unusual workflows, and the right entry point is almost always lower than teams assume.
The definition, without the vendor gloss

Inventory management software is a system of record for physical stock. Its job is to hold one trustworthy answer to what the business owns, where each unit sits, and what state it is in, sellable, reserved, damaged, in transit, and to keep that answer current as goods move. Everything else the category advertises, reorder automation, forecasting, barcode scanning, channel sync, is machinery built on top of that single source of truth.
The definition matters because it separates the category from its neighbors. Accounting software values inventory in currency for financial statements; inventory software counts and locates it in units for operations. Warehouse management systems go deeper into one building, directing the physical work of picking and putting away, while inventory software spans buildings and channels at the unit-quantity level. Order management systems own the customer order lifecycle and lean on inventory software to know what can be promised. Small tools blur these lines; the distinctions reassert themselves as operations grow.
A useful mental model: the software is a ledger with sensors. The ledger records every event that changes stock, a receipt, a pick, a sale, a return, a count correction, and the sensors are the scanners, integrations and forms that capture those events the moment they happen. Quantities on screen are not entered numbers; they are the running sum of the event history. That is the difference in kind from a spreadsheet, where the number in the cell is only ever what someone last typed.
This ledger-with-sensors model also explains the category's failure mode. When events bypass the sensors, goods leave without a scan, a return goes back on the shelf unrecorded, the ledger drifts from physical reality, and every downstream automation, reordering, channel sync, promising, computes confidently on wrong numbers. Good implementations are therefore less about features and more about closing the gaps where reality can sneak past the record.
The vocabulary the whole category rests on
- SKU (stock keeping unit)
- The identity of a distinct sellable item. One product in three sizes and two colors is six SKUs, and every count, reorder and report keys on them.
- Perpetual inventory
- The model where every stock movement is recorded as it happens, so quantities are always current. The alternative, periodic counting, only knows the truth on counting day.
- Available to promise (ATP)
- On-hand stock minus what is already committed to orders. The number that should drive what your sales channels display, and the one spreadsheets almost never track.
- Cycle counting
- Counting a small slice of stock on a rotating schedule instead of shutting down for an annual full count. The audit loop that keeps the ledger honest.
The core: a stock ledger, not a stock list
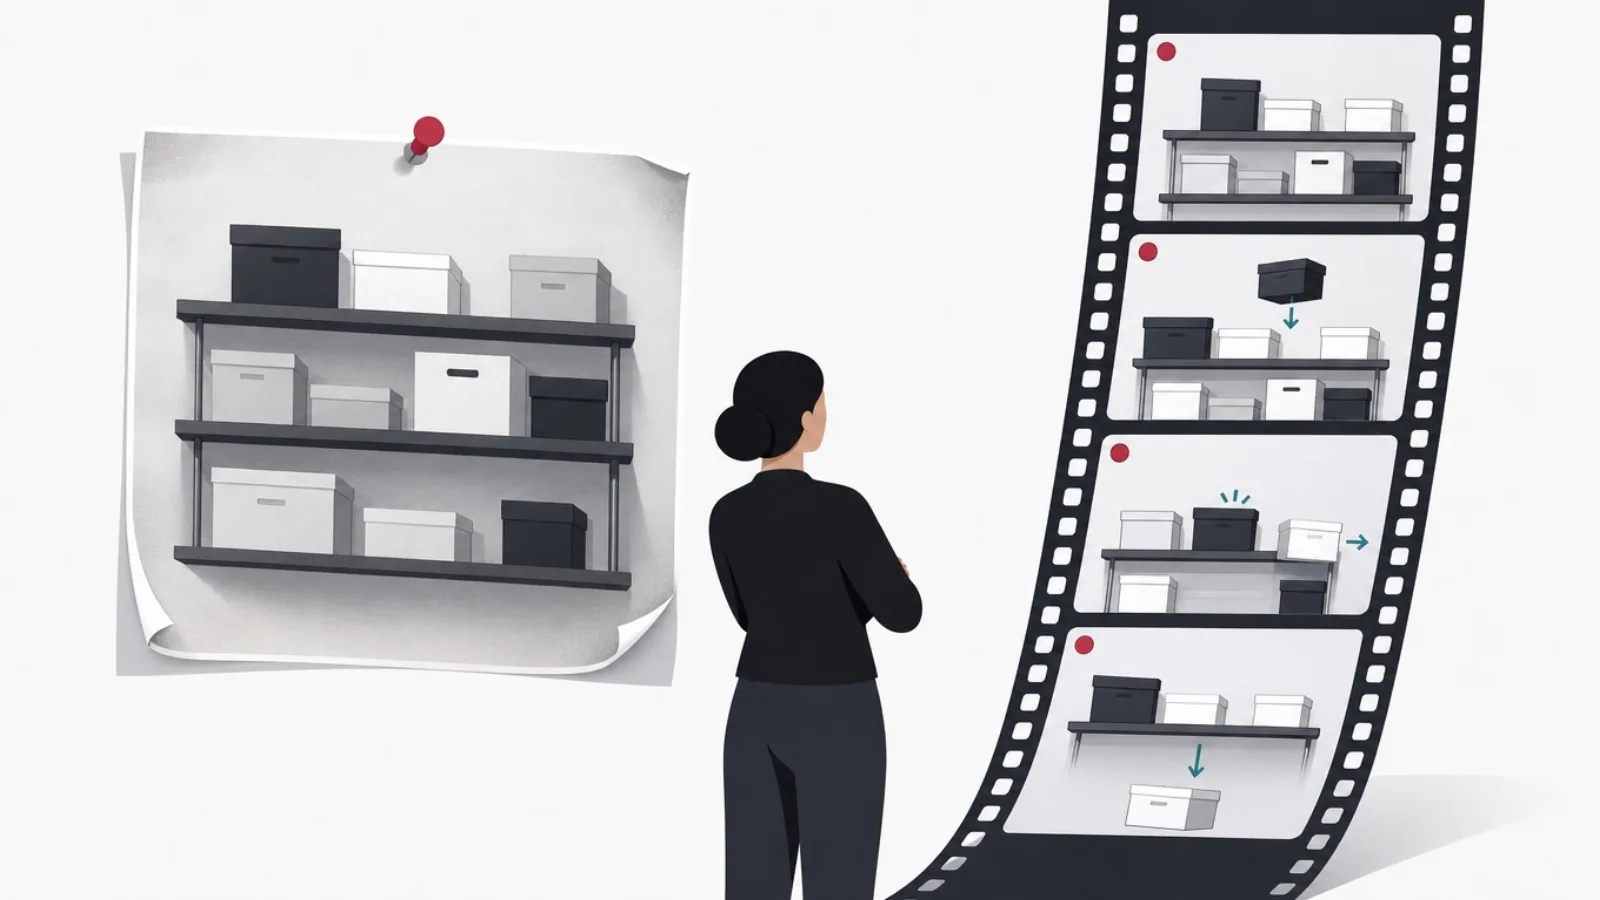
Open a well-built inventory system and the quantity you see for any SKU is a derived number: the sum of every transaction that ever touched it. Received 200, sold 37, returned 2, adjusted down 1 after a count, transferred 40 to the second warehouse: the on-hand figure at each location falls out of that arithmetic. The transactions are append-only, corrections are new entries, not edits, which gives the system a property no spreadsheet has: it can explain itself. When a number looks wrong, the history shows exactly which event made it wrong, when, and on whose scan.
The second structural idea is that one physical unit participates in several logical quantities at once. A unit sitting on the shelf is on hand; the moment a customer orders it, it becomes committed while still physically present; what channels may sell is available to promise, on hand minus committed; stock you have purchased but not received is on order or in transit. Serious systems track all of these per SKU per location, because each answers a different operational question, can we ship today, can we take this order, do we need to buy more, and collapsing them into one number is precisely how oversells happen.
Location modeling is the third layer. Beyond warehouse one and warehouse two, real systems model zones, aisles, bins and sometimes pallets, so the record says not just that twelve units exist but that eight sit in bin A-14 and four in the returns cage pending inspection. Batch and lot tracking, mandatory in food, pharma and cosmetics, and serial-number tracking for electronics and high-value goods, extend the same idea to which specific units, enabling recalls and warranty checks that quantity-only records cannot support.
None of this is exotic computer science, and that is rather the point: the data model is simple, rigorous bookkeeping applied to physical goods. The engineering difficulty lives elsewhere, in capturing events reliably at the edges, in syncing with channels fast enough to prevent overselling, and in keeping the model honest when humans improvise, which is the subject of the next section.
Why the ledger model earns its keep
How it works: the life of a unit through the system
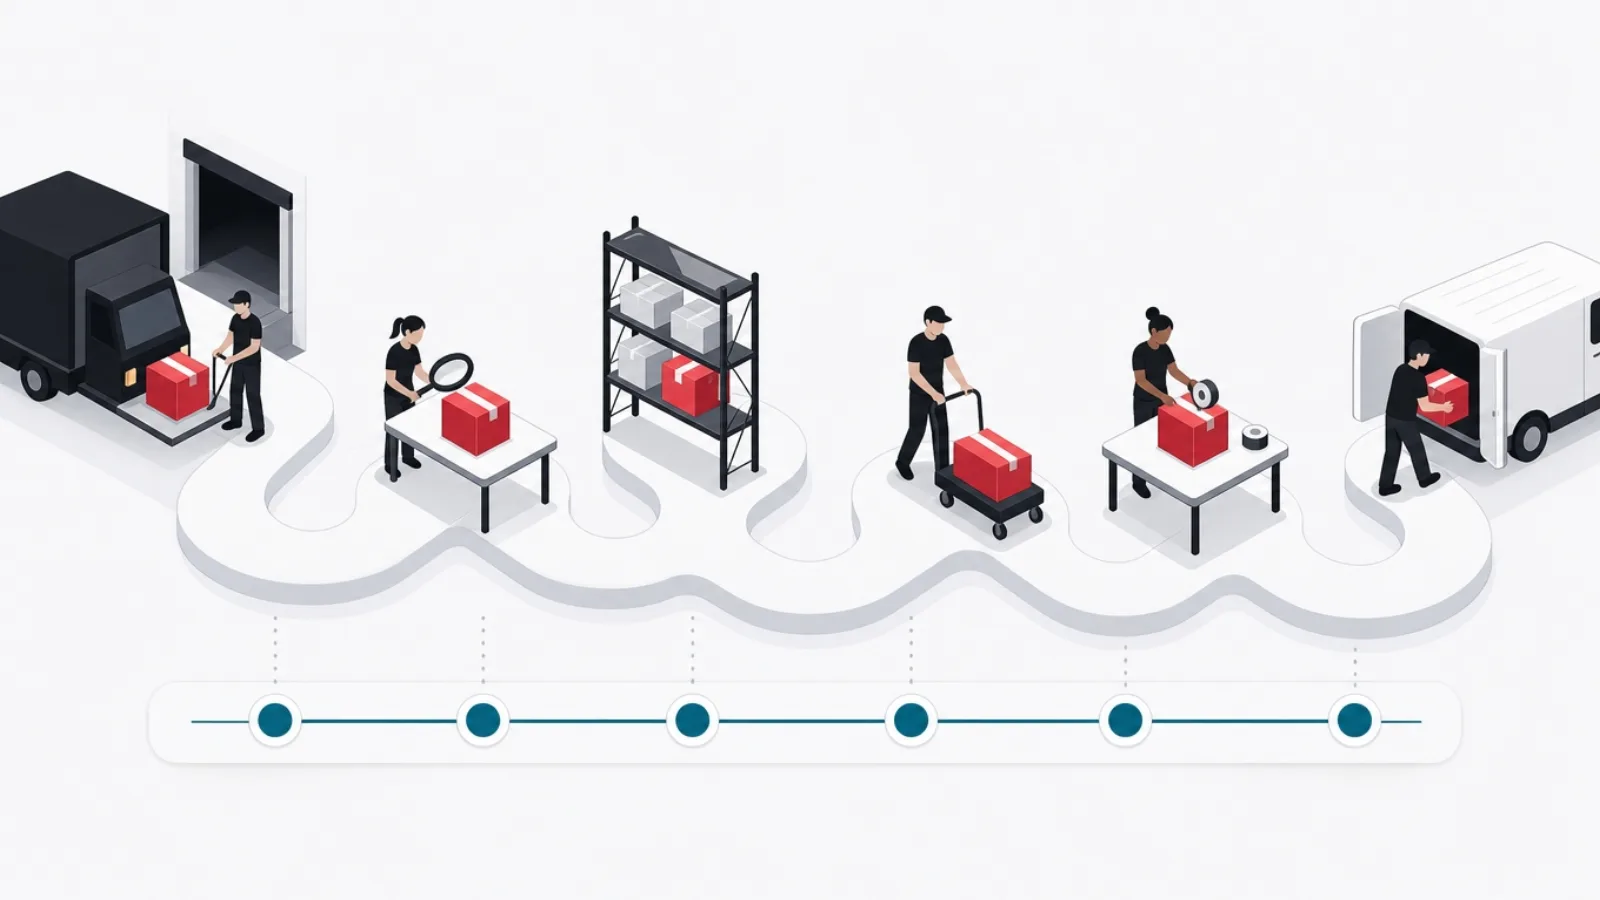
The clearest way to see the mechanics is to follow one unit of stock through a typical day. It begins as a line on a purchase order: the system records 100 units on order against the supplier, expected on a date, and that expectation already informs reordering math and can be promised against in some configurations. When the carton arrives, a worker scans the barcode at receiving; the system matches the scan to the open purchase order, flags any quantity or item mismatch on the spot, and moves 100 units into on hand at the receiving location, usually before the carton reaches the shelf.
A put-away step records where the units actually land, bin A-14, so pickers can later be routed to them. Then a sale arrives from any connected channel, the webstore, a marketplace, the point of sale, and the integration writes it into the system within seconds: one unit flips from available to committed, and every other channel's displayed availability drops by one. That last propagation is the single most valuable second of work the software does, because it is the mechanism that prevents two channels from selling the same last unit.
Fulfillment closes the loop: a pick list routes the worker to bin A-14, the pick scan confirms the right SKU left the right bin, packing and the shipping integration generate the label, and the shipped confirmation converts committed stock into a completed sale, decrementing on hand. A return, if one comes, reverses the flow with an inspection gate: scanned in, held in a returns location, and only restored to sellable stock by an explicit decision, so damaged units never silently rejoin the ledger.
Running quietly around this loop are the maintenance processes: cycle counts compare a bin's physical contents against the record on a rotating schedule and post corrections as auditable adjustments; reorder logic watches available stock against thresholds and drafts purchase orders when lines dip below them; and reporting reads the accumulated transaction history to answer the slower questions, what is turning, what is dead, what the operation actually owns, that spreadsheets answer only on counting day.
One unit, end to end
-
OrderedState: on order
A purchase order records 100 units expected from the supplier. The system now knows stock is inbound and factors it into buying decisions.
-
Received and put awayState: on hand, located
A scan at the dock matches the delivery to the PO, catches discrepancies immediately, and a put-away scan records the bin.
-
Sold on any channelState: committed
The order flows in via integration; one unit flips to committed and every other channel's availability updates within seconds.
-
Picked, packed, shippedState: sold
The pick scan verifies SKU and bin, the shipping integration prints the label, and shipment converts the commitment into a completed sale.
-
Counted and correctedState: verified
A scheduled cycle count compares the bin to the record and posts any variance as an auditable adjustment, keeping the ledger honest.
What it connects to, and why integrations are half the product
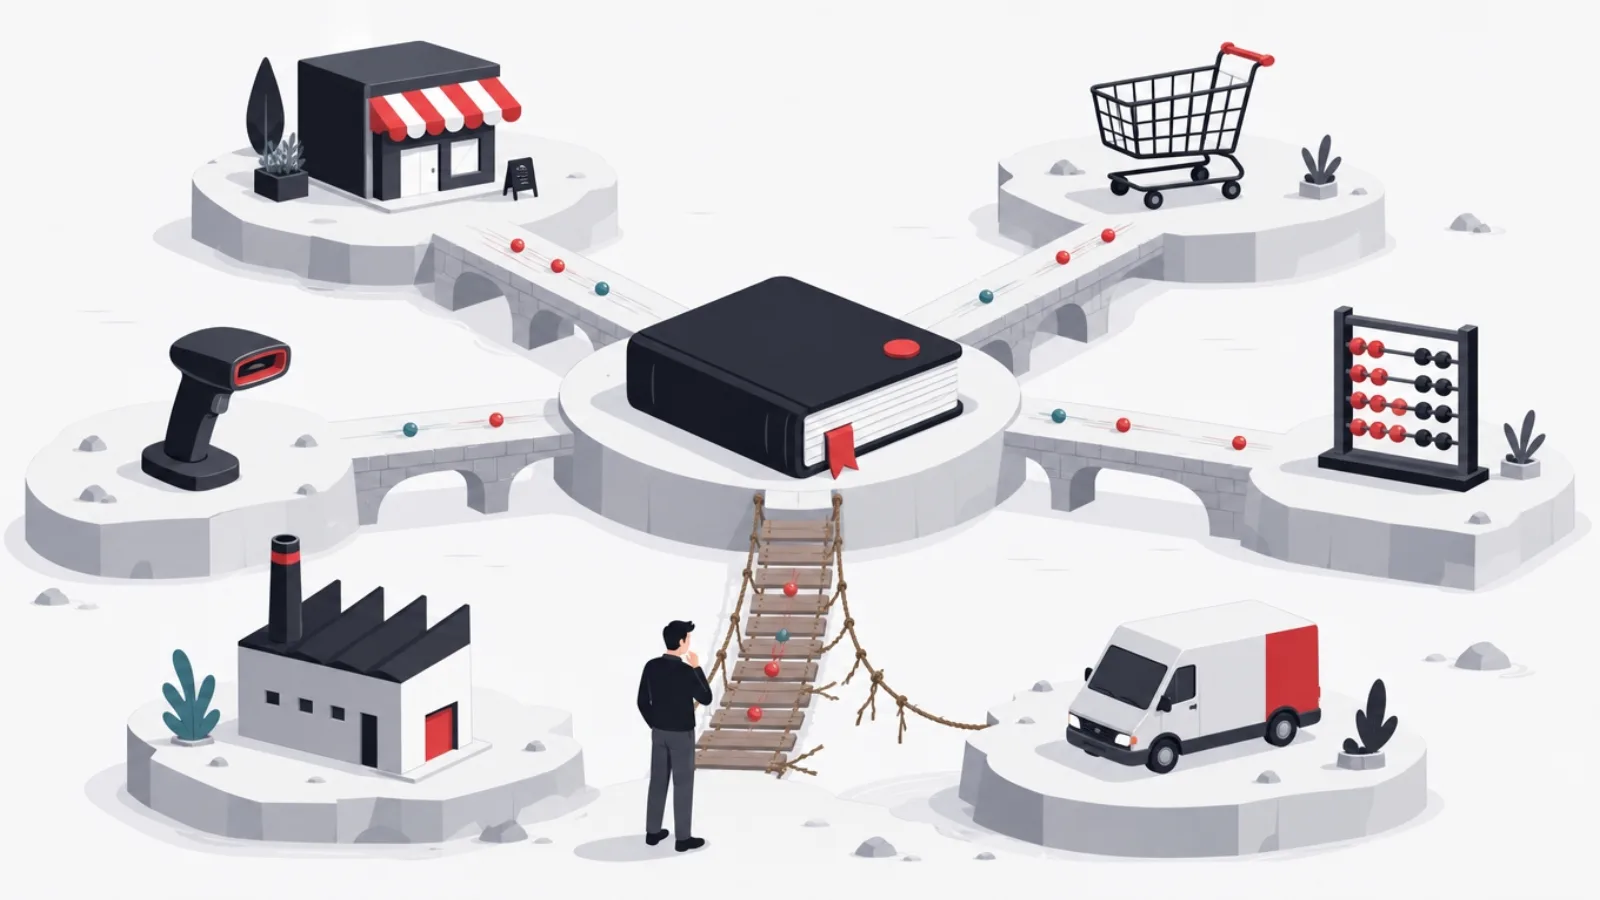
A stock ledger that only talks to itself is a better spreadsheet. The category's real value emerges from its connections, because inventory sits at the physical center of the business and nearly every other system needs its numbers. Sales channels are the first and most important integration: the webstore, marketplaces and point of sale push orders in and receive availability back, and the speed of that round trip is what stands between a multi-channel business and overselling. Slow sync, hourly batches rather than near-real-time events, is the most common technical cause of the oversell complaints that fill marketplace seller forums.
Accounting is the second pillar. The inventory system knows units; the books need values. Integrations post received stock, cost of goods sold and shrinkage adjustments into the accounting platform so the balance sheet tracks reality without double entry. Purchasing connects on the inbound side, suppliers, purchase orders, expected receipts, and shipping connects outbound, rates, labels, tracking, with the better systems treating both as native workflow rather than exported files.
Larger operations add deeper links: warehouse management systems for in-building optimization, manufacturing modules that consume raw-material SKUs into finished-good SKUs via bills of materials, forecasting tools that read the sales history, and business intelligence platforms that pull the transaction ledger into company-wide reporting. At this scale the inventory system functions as an operational hub, and evaluating one becomes an integration-architecture exercise, the subject we treat properly in the buyer's guide.
The practical advice hiding in all this: when comparing tools, weight the connector list and sync latency as heavily as any feature. A modest system that speaks natively to your exact sales channels and accounting platform beats a powerful one that reaches them through nightly CSV exports, because every manual bridge between systems is a place where the ledger and reality drift apart.
The spreadsheet boundary: when software stops being optional

Honesty requires saying clearly that plenty of businesses do not need inventory software yet. A single location, a single sales channel, a few dozen slow-moving SKUs and one person doing the buying is a shape a disciplined spreadsheet handles adequately, and the overhead of a system, setup, barcoding, process change, buys little. The boundary is not about revenue or ambition; it is about structure, and three structural thresholds mark it.
The first is a second place: a second location, a third-party warehouse, or simply meaningful stock in transit between places. Spreadsheets model one pile of goods; the moment stock exists in multiple places with movement between them, the single-cell quantity becomes a fiction. The second is a second channel: selling the same pool of stock on a webstore and a marketplace means two systems can sell the same unit in the same minute, and only event-speed sync through a shared ledger prevents it. The third is velocity: when daily movements outrun anyone's ability to type them in faithfully, the record decays in days regardless of discipline.
There are softer tells too: the business keeps a person whose real job is reconciling the spreadsheet; stockouts of best sellers coexist with cash locked in dead stock; the annual count produces a shrinkage number nobody can explain; promising a delivery date requires a phone call to the warehouse. Each is the same underlying fact wearing different clothes, the record and reality have parted, and headcount is being spent to paper over the gap.
Crossing the boundary does not mean jumping to heavy software. Entry SaaS tools start at tens of dollars a month and implement in days, and the sensible move is the smallest system that closes your actual gap, multi-channel sync, or multi-location tracking, or barcode-verified picking, rather than the most impressive one. The tiers, and how to climb them, are mapped in our operational guide.
Reading your own boundary honestly
Do this
- Count places, channels and speedOne location, one channel, slow turnover: the spreadsheet is fine. Any second place, second channel or fast movement: the boundary is crossed.
- Price the reconciliation headcountHours spent fixing the spreadsheet each week are the real current cost of not having a system. Compare tools against that number, not against zero.
- Start with the gap, not the ceilingBuy the smallest tool that closes your specific failure, oversells, lost stock, blind reordering. You can climb tiers later with your data intact.
- Barcode from day one of any systemTyped entries drift; scans do not. The cheap scanner is the accuracy program.
Not this
- Wait for the annual count to decideBy the time shrinkage shows up in a yearly count, a season of bad buying and overselling has already been paid for.
- Blame discipline for a structure problemNo amount of carefulness lets one spreadsheet track two locations and two channels in real time. The failure is architectural.
- Jump straight to enterprise softwareOversized systems fail small teams through complexity. The entry tier exists because it fits.
- Keep the spreadsheet as a shadow systemTwo records means two truths. The migration is done when the spreadsheet is read-only history.
What it costs, from SaaS tiers to custom builds
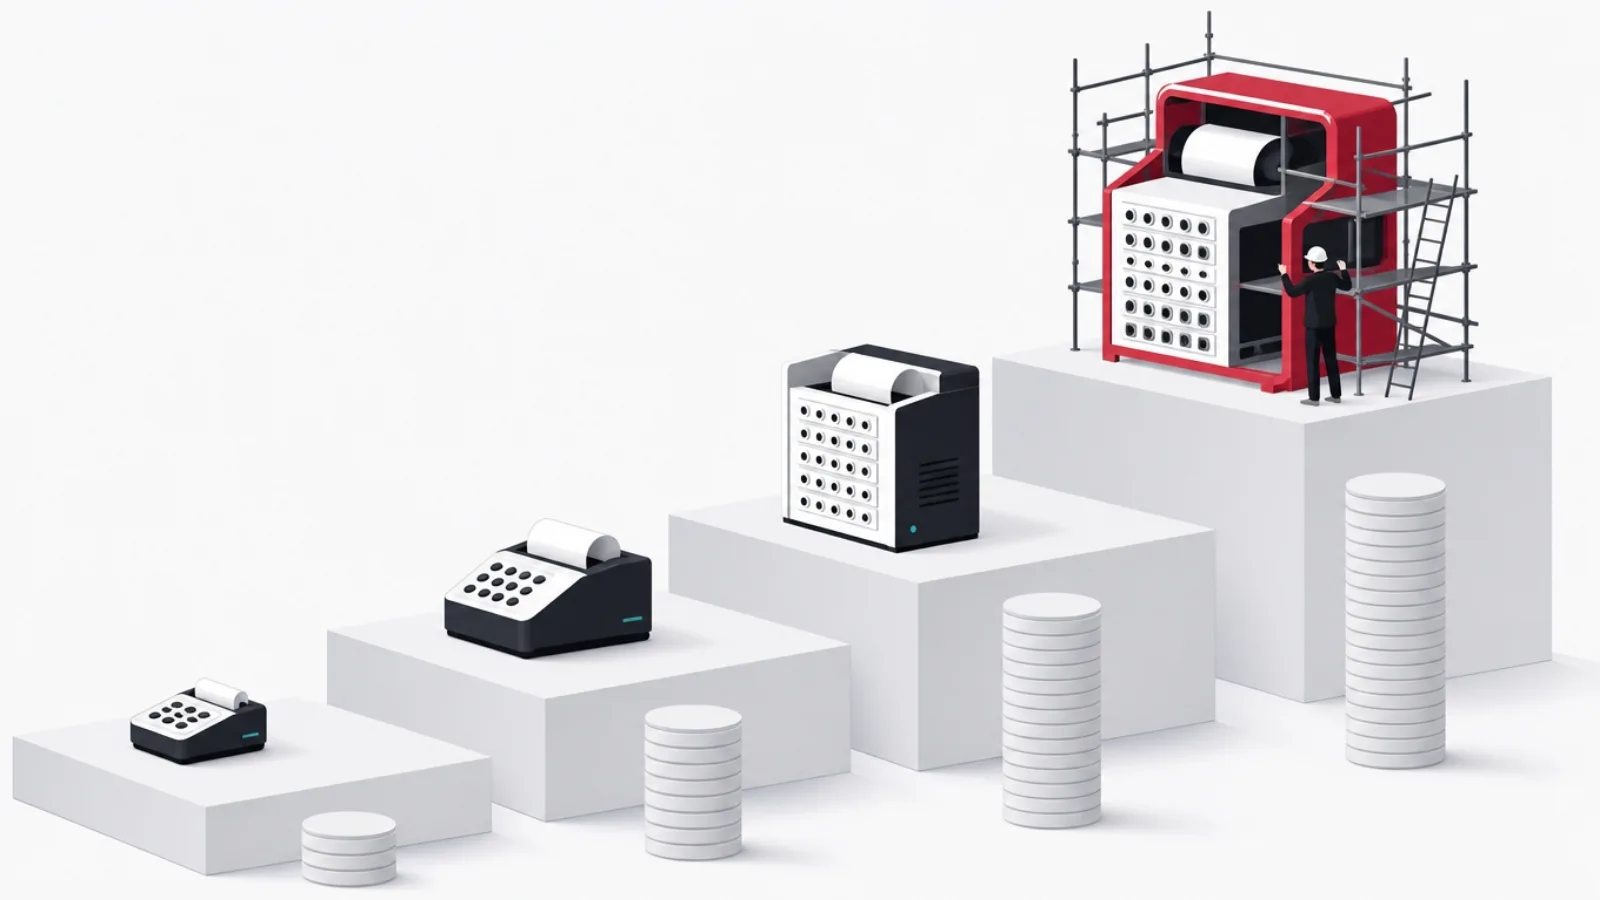
The market prices in tiers that map to the structural thresholds above. Entry SaaS for small businesses runs from roughly 30 to 150 dollars a month: multi-channel sync, basic multi-location support, barcode scanning via phone apps, and the standard accounting connectors. Mid-market platforms run from a few hundred to a few thousand a month, adding warehouse workflows, purchasing depth, manufacturing bills of materials, batch and serial tracking, and API access. Enterprise systems and full warehouse management suites are quote-priced and implementation-heavy, with the software license often the smaller half of a project that includes process design, hardware and integration engineering.
The costs that surprise buyers are rarely the subscription. Implementation time is the first: even entry tools demand clean SKU data, a barcoding pass over the physical stock and a starting count, days to weeks of real work that determines whether the system starts true. Hardware is modest but real, scanners, label printers. And integration gaps are the recurring one: the connector to your exact marketplace, accounting locale or shipping carrier either exists, costs extra through a middleware platform, or must be built.
Custom software enters the conversation in two honest situations, and fewer dishonest ones than the pitch decks suggest. The first is genuinely unusual workflow: rental fleets, consignment networks, perishables with complex dating rules, field inventory in vehicles, patterns that standard tools model badly enough that teams drown in workarounds. The second is integration centrality at scale: when the inventory ledger must feed a dozen internal systems with company-specific logic, owning that hub can beat renting it. The usual wrong reason is customization appetite that configuration would have satisfied.
AgileTech's work in this category is mostly the second pattern and its edges, custom layers, integrations and dashboards around a commercial core, with full custom builds reserved for the genuinely unusual workflows. The build-versus-buy arithmetic, and what each path realistically costs, follows the same logic we lay out in our cost guide: buy the commodity, build only the difference.
The market in four tiers
| Typical monthly cost | Built for | The step up buys | |
|---|---|---|---|
| SpreadsheetFree | $0 | One location, one channel, slow stock | Nothing; it is the baseline |
| Entry SaaSDays to implement | $30 to $150 | Small multi-channel sellers | Real-time sync, scanning, one truth |
| Mid-market platformWeeks to implement | $300 to $3,000 | Multi-warehouse, manufacturing, lots | Workflow depth, API, batch and serial tracking |
| Enterprise or customMonths to implement | Quote or build budget | Unusual workflows, hub-scale integration | Exact fit and owned integration logic |
Common misconceptions, corrected briefly
The software counts my stock for me. It does not; it remembers what your scans and integrations tell it, perfectly. Physical counting remains a human job, which the system reduces from an annual shutdown to small rotating cycle counts, and makes meaningful by giving every count a record to check against. Teams that skip the counting loop end up with a very confident wrong number, which is arguably worse than a hesitant one.
My accounting platform already does this. Accounting inventory answers what the stock is worth for the financial statements; operational inventory answers where units are and what can be promised. The small-business accounting suites include simple quantity tracking that genuinely suffices below the spreadsheet boundary, but it shares the spreadsheet's structural limits, thin location modeling, no scanning workflow, batch-speed channel sync, and businesses that lean on it past those limits meet the same failure modes.
It will fix our stockouts by forecasting. Reorder automation is real and valuable, but it computes on the ledger's history and current quantities. If the record is drifting, automation simply buys the wrong things faster. The honest sequence is accuracy first, capture events, run cycle counts, trust the numbers, then automation, which is also why implementations that start with the scanner succeed more often than ones that start with the forecasting module.
And the quiet one: we are too small for this. The entry tier exists precisely for ten-SKU, two-channel sellers, implements in days, and costs less monthly than one oversell refund. Size was the barrier a decade ago; today the boundary is structure, and a two-person shop selling one pool of stock on two channels is structurally past it, however small the revenue.
The system is a mirror, not a magician. It reflects what your scans tell it with perfect memory, and that is the whole trick: businesses do not fail at inventory because they lack intelligence, they fail because nobody can remember four thousand movements a week. Software remembers.
The honest conclusion
Inventory management software is bookkeeping for physical goods: a perpetual ledger fed by scans and integrations, distinguishing the quantities that matter, on hand, committed, available, inbound, and propagating one truth to every channel and system that needs it. That is the whole idea, and its value scales with structure: the more places stock lives, the more channels sell it, and the faster it moves, the more the ledger earns.
The decision framework compresses to three questions. Does stock live in more than one place? Does more than one channel sell the same pool? Do daily movements outrun faithful manual entry? Zero yeses: keep the spreadsheet with a clear conscience. One or more: the entry SaaS tier closes the gap in days for tens of dollars a month, and the feature checklist will tell you which capabilities your yes actually requires.
Climb tiers only when the operation's structure demands it, mid-market for warehouses, manufacturing and lot tracking, and reserve the custom conversation for genuinely unusual workflows or hub-scale integration needs, where owning the logic beats renting it. At every tier, the implementation habits matter more than the brand: barcode from day one, cycle count on a schedule, integrate on events rather than batches, and retire the spreadsheet completely.
And keep the mirror principle in view: the software remembers perfectly and verifies nothing. Its numbers are as honest as the capture discipline at the edges, which is why the best implementations spend their effort at the dock door and the packing bench, not the reporting screen. Get the events in truthfully, and everything this category promises, fewer stockouts, no oversells, buying driven by data, follows as arithmetic.
The five-minute self-assessment
- Count your placesWarehouses, stores, 3PLs, meaningful stock in transit. More than one means the spreadsheet quantity is already a fiction.
- Count your channelsWebstore, marketplaces, POS, wholesale. More than one selling the same pool means oversell risk only event-speed sync removes.
- Time your busiest dayIf movements outrun faithful typing, the record decays regardless of discipline. Velocity is the third threshold.
- Price your reconciliation hoursThe weekly cost of fixing the spreadsheet is the budget a starter tool competes against.
- Check your unusualness honestlyRental, consignment, perishables, field stock: genuinely unusual workflows justify the custom conversation. Ordinary retail does not.
Frequently asked questions
What is inventory management software in simple terms?
It is a system that keeps one live, trustworthy record of what stock you own, where each unit sits, and what is already promised to customers, updating automatically as goods are received, sold, moved and returned. Think of it as bookkeeping for physical goods: every movement is a recorded transaction, so quantities are computed facts rather than numbers someone last typed into a spreadsheet.
How does inventory management software actually work?
Through a ledger fed by events. Barcode scans at receiving, picking and counting, plus orders flowing in from connected sales channels, each write a transaction against a SKU at a location. Quantities on screen are the running sum of that history. The system then propagates availability back to every channel within seconds, drafts purchase orders when stock dips below thresholds, and posts values to accounting.
What is the difference between inventory software and a WMS?
Scope and depth. Inventory management software tracks unit quantities across all locations and channels, the what, where and how many. A warehouse management system goes deep inside one building, directing the physical work: pick paths, wave planning, labor tasks, dock scheduling. Small operations need only the first; large fulfillment operations typically run both, integrated, with the WMS executing what the inventory ledger records.
Can I just use Excel for inventory management?
Yes, within a specific structure: one location, one sales channel and stock that moves slowly enough for faithful manual entry. Past any of those thresholds the spreadsheet fails architecturally, not from lack of discipline: it cannot sync two channels in real time, cannot model stock in two places, and cannot keep up with velocity. Entry systems start around 30 to 150 dollars a month precisely to cover that gap.
How much does inventory management software cost?
Entry SaaS for small multi-channel sellers runs roughly 30 to 150 dollars a month. Mid-market platforms with warehouse workflows, manufacturing and lot tracking run a few hundred to a few thousand. Enterprise suites are quote-priced with significant implementation projects. The under-budgeted costs are implementation labor, clean SKU data, barcoding and a starting count, and any integration connectors your exact channel or accounting mix requires.
When does custom inventory software make sense?
In two honest cases. First, genuinely unusual workflows, rental fleets, consignment networks, perishables with complex dating, vehicle-based field stock, that standard tools model so badly the team drowns in workarounds. Second, hub-scale integration: when the ledger must feed many internal systems with company-specific logic, owning that hub can beat renting it. Ordinary retail and ecommerce almost never need custom; configuration and edge extensions cover it.
Inventory software is bookkeeping for physical goods, and the hard part is capturing reality at the edges. When your operation needs a system the platforms cannot model, work with AgileTech, a top software house company in Vietnam that builds the ledgers, integrations and warehouse systems your workflow actually requires.
Source: https://agiletech.vn/blog/what-is-inventory-management-software/ · (c) AgileTech Vietnam. Printed from agiletech.vn.