 Nguyen Manh Thang
Chief Executive Officer, AgileTech Vietnam
Nguyen Manh Thang
Chief Executive Officer, AgileTech Vietnam
- Published
- Read time
- 14 min
- Views
- 69

Read the AI overview
Power BI and Looker Studio solve the same problem, turning data into shared dashboards, from opposite starting points. Power BI is a full business intelligence platform: it imports and models data in its own engine, has a rich modeling language (DAX), handles hundreds of millions of rows in memory, and comes with enterprise governance, but it costs per user or per capacity and lives most comfortably inside a Microsoft 365 organization. Looker Studio is a free, browser-based reporting layer that queries data where it sits, connects natively to Google Analytics, Ads, BigQuery, and Sheets, and lets a marketing or operations team build a shareable dashboard in an afternoon, but its modeling is thin, performance depends entirely on the source, and governance features live in the paid Pro tier. Pick Power BI when the data needs modeling, the volumes are large, the organization runs on Microsoft, or governance is a requirement. Pick Looker Studio when the data is already in Google's ecosystem or a warehouse like BigQuery, the audience is marketing or operations, and the budget is zero. Many mid-size companies end up with both, Looker Studio for marketing and Power BI for finance and operations, and that is not a failure.
Somebody in every company eventually asks for a dashboard, and the question that follows is which tool to build it in. For most small and mid-size organizations the shortlist ends up as two names: Power BI, Microsoft's business intelligence platform, and Looker Studio, the free Google reporting tool that many people still call Data Studio, its name until 2022. They are compared constantly and the comparisons are usually wrong in the same way, treating them as two versions of the same thing with a longer feature list on one side.
They are not the same thing. Power BI is a data platform with a reporting layer on top; Looker Studio is a reporting layer with connectors underneath. That difference in architecture explains why one costs money and the other is mostly free, why one handles a hundred million rows and the other depends on the database, why one has a modeling language people write books about and the other has calculated fields, and why one belongs to the finance team and the other to marketing in so many companies.
This comparison works through the differences that decide the choice: architecture, connectors, modeling, licensing, performance, governance, embedding, and ecosystem fit. It ends with a decision tree and a section on the layer underneath both tools, because the most common reason a dashboard project fails is not the tool. Teams that want the broader landscape first should read the roundup of business intelligence tools; this article assumes the shortlist is already these two.
Key takeaways
- Power BI is a modeling-first BI platform; Looker Studio is a query-first reporting layer. The architecture difference explains almost every other difference.
- Looker Studio is free for most use, with a per-user Pro tier for governance. Power BI has a free desktop tool but sharing requires Pro per user or Premium per capacity, which is where the cost lives.
- Data volume decides more than features: Power BI's in-memory engine handles large datasets on its own; Looker Studio is only as fast as the database behind it, so it shines on BigQuery and struggles on a slow spreadsheet.
- Ecosystem fit is the tiebreaker. Microsoft 365 organizations get Power BI inside Teams, Excel, and Fabric; Google Workspace organizations get Looker Studio inside Analytics, Ads, and Drive.
- Governance, row-level security, certified datasets, and lineage are mature in Power BI and partial in Looker Studio Pro. Regulated or large organizations should weight this heavily.
- Neither tool fixes bad data. The warehouse and modeling layer underneath decide whether either dashboard is trustworthy.
Two architectures: model-first against query-first
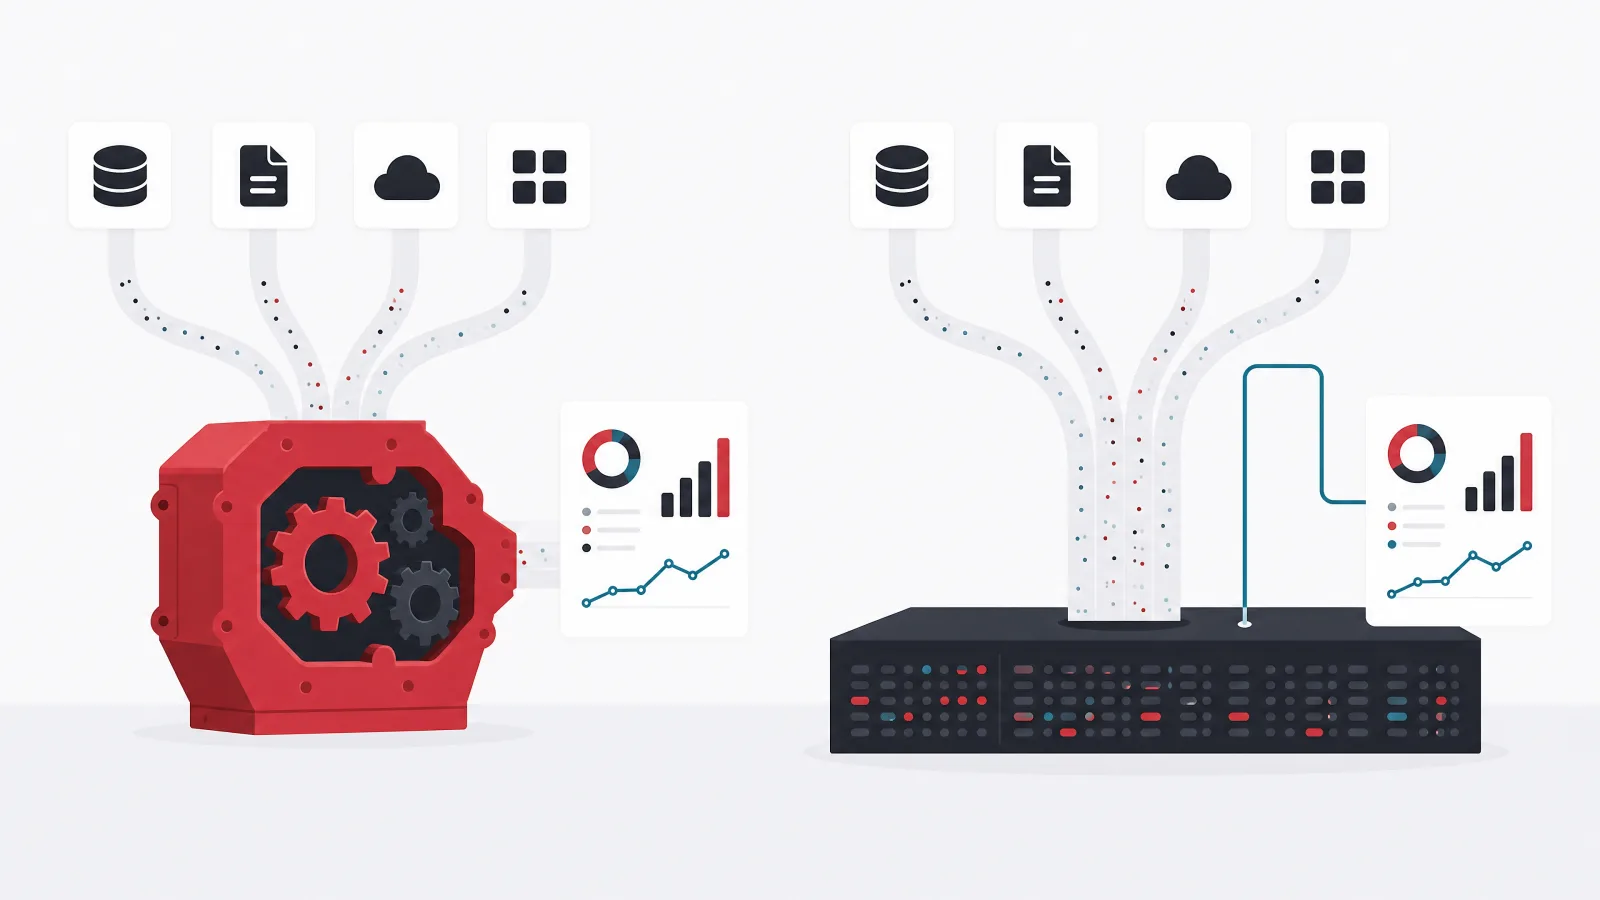
Power BI's default mode is import. Data is pulled from its sources on a schedule into Power BI's in-memory columnar engine (the same VertiPaq engine behind Analysis Services), compressed, and modeled: tables are related, measures are defined in DAX, hierarchies and formats are set. Reports then query that model, not the sources, which is why Power BI is fast on large data regardless of how slow the source is, and why the model becomes a reusable asset that many reports share. Power BI also has DirectQuery mode, which queries the source live for cases where data must be current or cannot be copied, at a performance cost.
Looker Studio has no engine of its own for most sources. A report connects to a data source (Google Analytics, BigQuery, a Sheet, a database via a connector) and each chart issues queries to it when the report loads or a filter changes. There is a cache layer, and BigQuery connections can use BI Engine to accelerate queries, but the principle is that the data stays where it is and Looker Studio asks it questions. The advantage is zero data movement and zero staleness; the cost is that report performance is whatever the source can deliver, and modeling (joins, complex calculations) mostly has to happen in the source or in a limited blend feature.
This is the root of the other differences. A model-first tool needs a modeling language, a refresh schedule, capacity to hold the data, and governance over the models, all of which Power BI has and charges for. A query-first tool needs connectors and a good source database, which Looker Studio has, and can be free because the compute is happening in your BigQuery bill or your Analytics account. Choosing between them is largely choosing where you want the modeling to live.
The architectural differences in one table
| Dimension | Power BI | Looker Studio |
|---|---|---|
| Default data mode | Import into in-memory model; DirectQuery optional | Live query to source; cache and BI Engine on BigQuery |
| Where modeling happens | In Power BI (relationships, DAX measures) | Mostly in the source; blends and calculated fields for light work |
| Performance on large data | Engine-bound; hundreds of millions of rows in memory | Source-bound; excellent on BigQuery, poor on Sheets |
| Data freshness | Scheduled refresh (8 per day Pro, 48 Premium) or DirectQuery | As fresh as the source at query time, subject to cache |
| Authoring tool | Power BI Desktop (Windows) plus web editing | Browser only |
| Reusable semantic layer | Yes: shared datasets, certified models | Limited: reusable data sources; Looker (the full product) for LookML |
Every row below follows from the first one. Power BI holds and models data; Looker Studio queries it where it lives.
Connectors and modeling: breadth against depth in the ecosystem you already have
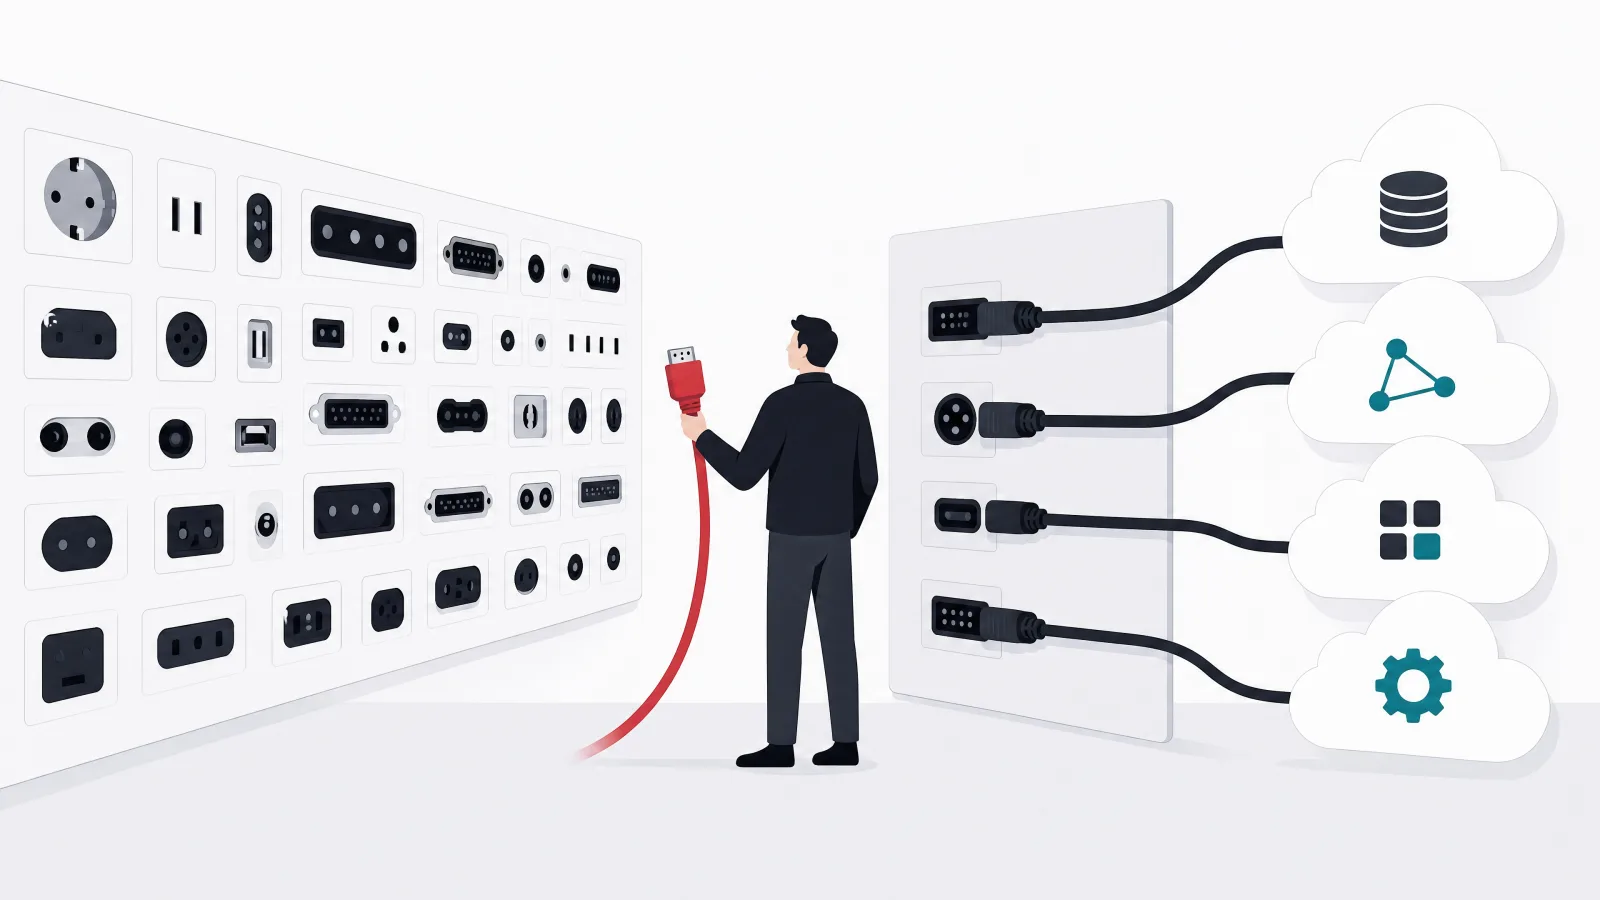
Power BI ships with well over a hundred connectors covering databases, files, SaaS applications, Azure and other clouds, and generic ODBC and OData, plus Power Query, a transformation layer that can reshape almost anything before it reaches the model. For a company whose data lives in SQL Server, Dynamics 365, SharePoint, Excel, Salesforce, and an assortment of SaaS tools, Power BI will connect to all of it and let a competent analyst clean and join it without writing SQL. The Google connectors exist but are not its strength; connecting Google Analytics 4 to Power BI generally means a third-party connector or an export to BigQuery first.
Looker Studio's native connectors are Google's products (Analytics, Ads, Search Console, YouTube, Sheets, BigQuery, Cloud SQL, Campaign Manager) plus a set of general database connectors (MySQL, PostgreSQL, and others) and a large partner connector gallery, much of it paid, for non-Google SaaS. For a marketing team, the native Google connectors are the reason to use it: a GA4 and Ads dashboard in Looker Studio takes an hour and needs no data engineering. For a finance team whose data is in an ERP, the connector story is thinner and usually runs through a warehouse.
Modeling is where the depth difference is starkest. Power BI's DAX is a full analytical language: time intelligence (year-to-date, same period last year), context-aware measures, complex ratios across related tables, and row-level security expressions. It has a learning curve, and organizations that adopt Power BI seriously end up with someone who knows DAX well. Looker Studio offers calculated fields with a function library, parameters, and data blending that joins up to five sources on shared keys; it handles marketing metrics comfortably and struggles the moment a calculation needs to reach across tables in a way blending cannot express. The pragmatic pattern for Looker Studio is to do the modeling in BigQuery views and treat the tool purely as a presentation layer, which works well and is what teams that use it at scale do.
Connector and modeling fit by where your data lives
| Power BI | Looker Studio | |
|---|---|---|
| Google Analytics, Ads, Search Console | Partial | Yes |
| BigQuery | Yes | Yes |
| SQL Server, Azure SQL, Synapse, Fabric | Yes | Partial |
| Excel and SharePoint | Yes | Partial |
| Google Sheets | Partial | Yes |
| Dynamics 365, Salesforce, ServiceNow | Yes | Partial |
| Snowflake, Redshift, Databricks | Yes | Partial |
| Time intelligence and cross-table measures | Yes | No |
| Transformation before load | Yes | No |
Filled means native, first-class support; partial means possible through a connector, export, or workaround; empty means an uphill fight.
Licensing: what free means in each, and where the money goes

Looker Studio is free for building and sharing reports with anyone who has a Google account, with no per-user or per-report fee, and that is the whole reason it is on most shortlists. The costs are indirect: BigQuery query charges when reports hit a warehouse, paid partner connectors for non-Google sources, and the analyst time spent doing modeling in the source. Looker Studio Pro, introduced in 2022, adds team workspaces, Google Cloud project association, enterprise support, and governance features for an indicative price of around 9 dollars per user per project per month as of mid 2026. It is a modest fee for organizations that need administrative control; small teams rarely need it.
Power BI has a free tier, but it is the desktop authoring tool and a personal workspace; sharing a report with anyone else requires that both the author and every viewer hold a Pro license, indicatively around 14 dollars per user per month, or that the content sit in a Premium capacity. Premium per user, indicatively around 24 dollars per user per month, adds larger models, more refreshes, paginated reports, and AI features. Premium per capacity, now folded into Microsoft Fabric capacities, starts at a few thousand dollars a month and lets unlimited viewers consume content without individual licenses, which is the economical route past a few hundred users. Power BI Pro is also included in Microsoft 365 E5, so organizations on E5 effectively already have it.
The comparison is therefore not free against paid; it is paid-in-warehouse-compute-and-analyst-time against paid-per-seat. For a 20-person marketing team on Google Workspace, Looker Studio costs nothing and Power BI costs roughly 280 dollars a month plus the Windows machines to author on. For a 400-person company on Microsoft 365 E5, Power BI costs nothing incremental and Looker Studio would cost the warehouse work to make it useful. Total cost follows the ecosystem, which is why the ecosystem question in the next sections usually settles the licensing question too.
Licensing tiers, indicative mid 2026 list prices
| Tier | Indicative price | What it unlocks | Who it fits |
|---|---|---|---|
| Looker Studio | Free | Unlimited reports and viewers; Google connectors; community connectors | Marketing, small teams, anyone on Google Workspace |
| Looker Studio Pro | ~9 per user per project per month | Team workspaces, Cloud project link, support, governance controls | Teams that need administration and support |
| Power BI Free | Free | Desktop authoring; personal workspace; no sharing | Individual analysts; evaluation |
| Power BI Pro | ~14 per user per month (in M365 E5) | Sharing, workspaces, 8 refreshes a day, 1 GB models | Most organizations under a few hundred users |
| Power BI Premium per user | ~24 per user per month | 100 GB models, 48 refreshes, paginated reports, AI features | Analysts with large models; finance teams |
| Fabric capacity (Premium) | From a few thousand per month | Unlimited free viewers, dedicated capacity, Fabric workloads | Hundreds to thousands of viewers; embedding at scale |
Indicative and rounded; confirm on each vendor's pricing page. Enterprise agreements, E5 bundling, and regional pricing change the numbers.
Performance and scale: the engine or the warehouse

Power BI's import mode makes it fast almost regardless of source. A model of fifty million rows compresses to a few hundred megabytes in VertiPaq and answers most visual queries in under a second on Pro; Premium per user extends models to a hundred gigabytes. The constraints are the refresh window (a large model may take an hour to refresh and Pro allows eight refreshes a day), the memory limits per tier, and the skill needed to design a star schema that compresses well. Badly modeled Power BI, with wide flat tables and many-to-many relationships, gets slow and large, but the fix is in the analyst's hands.
Looker Studio is exactly as fast as the source. On BigQuery with BI Engine reservations it is fast on billions of rows, because BigQuery is doing the work and Looker Studio is drawing the result. On Google Analytics it is fast because Google is serving pre-aggregated data. On a Google Sheet of 50,000 rows it is tolerable; on a Sheet of 500,000 rows or a slow MySQL instance over a community connector, reports time out and filters lag. The discipline that makes Looker Studio perform at scale is to put the data in BigQuery, aggregate it in views or scheduled queries, and point the report at the aggregates.
Concurrency follows the same logic. Power BI on a capacity has defined limits and the capacity can be sized; Looker Studio concurrency is a BigQuery concurrency and cost question. For a report that hundreds of people open every Monday morning, Power BI on Premium capacity is predictable; Looker Studio on BigQuery is predictable only if the queries are cached or BI Engine is reserved, and the bill scales with the audience if they are not. Teams that need data engineering to make either tool fast usually discover that the warehouse and aggregation work is the same in both cases; it is just visible in Looker Studio and hidden inside the model in Power BI.
Governance and security: where the enterprise features live

Power BI's governance is mature because its customers demanded it. Row-level security is defined in the model with DAX filters and enforced for every report on that model; object-level security hides columns and tables; sensitivity labels from Microsoft Purview flow through to exports; datasets can be endorsed as promoted or certified so that report builders know which source of truth to use; lineage views show which reports depend on which datasets and sources; and the admin portal controls sharing, export, and external access tenant-wide. Deployment pipelines move content through development, test, and production workspaces. For a regulated organization or one with a data governance function, this is table stakes and Power BI has it.
Looker Studio's governance is lighter and lives mostly in Pro. Sharing follows Google Drive semantics (viewer, editor, owner, link sharing) with organizational controls from Workspace; Pro adds team workspaces with role-based content management, association with a Google Cloud project for administration and audit logging, and the ability to restrict data sources. Row-level security is achievable for BigQuery sources by using the viewer's credentials against BigQuery's own row-level access policies, which is elegant but puts the governance in the warehouse rather than the tool. There is no equivalent of certified datasets or lineage across reports; teams manage this by convention.
The practical read is that Looker Studio governance is fine for a marketing team sharing dashboards internally and inadequate for a finance function publishing numbers that will be quoted to a board or a regulator without a strong warehouse-level control layer behind it. Power BI governance is adequate for both and costs the administration effort to use it. Organizations already running Microsoft consulting and platform work will find that Power BI's governance plugs into Entra ID groups, Purview labels, and Teams permissions they already manage.
Governance questions to answer before choosing
- Will numbers from these dashboards be quoted externally?If yes, you need certified sources, lineage, and controlled export. Power BI has all three natively.
- Do different viewers need to see different rows?Both can do it. Power BI in the model; Looker Studio through BigQuery policies with viewer credentials.
- Is there a data classification scheme to enforce?Purview labels flow through Power BI. Looker Studio relies on Workspace and Cloud controls.
- Who administers sharing and external access?Power BI admin portal, tenant-wide. Looker Studio Pro workspaces plus Workspace admin.
- Do you need dev, test, and production separation?Power BI deployment pipelines. Looker Studio by copying reports and swapping sources.
Embedding, sharing, and the audience outside the company
Sharing internally is easy in both, with the licensing caveat that every Power BI viewer needs a Pro license or a capacity behind the content, while Looker Studio viewers need only a Google account (or none, for public link sharing). For an internal audience on Microsoft 365, Power BI reports embed in Teams channels, SharePoint pages, and PowerPoint, and Excel can connect live to a Power BI dataset, which finance teams love. For an internal audience on Google Workspace, Looker Studio reports embed in Sites and can be scheduled as PDF emails, and Sheets can pull from the same BigQuery sources.
Embedding for customers, in a product or a client portal, is a different matter. Power BI Embedded is a well-developed path: an application authenticates with a service principal, generates embed tokens with row-level security applied per customer, and renders reports in an iframe or the JavaScript SDK, paying for an embedded capacity rather than per viewer. It is the standard way SaaS products in the Microsoft ecosystem ship analytics. Looker Studio embedding is an iframe of a report shared by link or with specific Google accounts; there is no token-based per-customer security and no API for programmatic generation, so it works for a public dashboard or a trusted client and not for a multi-tenant product. Teams that need embedded analytics in a product generally choose Power BI Embedded, Looker (the full Looker product, distinct from Looker Studio), or a purpose-built embedded analytics library.
Public sharing cuts the other way. Looker Studio can publish a report to anyone with the link, which makes it the natural tool for public-facing dashboards, agency reporting to clients, and any case where the audience is outside the organization and does not have licenses. Power BI's publish to web feature exists but is often disabled by administrators because it exposes data publicly, and licensed external sharing requires guest accounts. Agencies running client reporting overwhelmingly use Looker Studio for this reason alone.
Governance habits that keep either tool trustworthy
Do this
- Power BI Embedded for product analyticsService principal, embed tokens, row-level security per tenant, capacity pricing independent of viewer count.
- Looker Studio for agency and public reportingLink sharing, scheduled PDF delivery, no licenses for the audience.
- Excel live to Power BI datasetsFinance keeps its spreadsheets; the numbers come from the governed model.
- BigQuery as the shared layerBoth tools connect to it well; putting the data there keeps the choice reversible.
Not this
- Looker Studio iframes as multi-tenant product analyticsNo per-customer token security; a link is a link.
- Power BI publish to web for anything sensitiveIt is public. Administrators disable it for good reason.
- Licensing every external viewer for Power BI ProPast a handful, capacity or embedding is cheaper and simpler.
- Pointing Looker Studio at a giant SheetIt will time out. Move the data to BigQuery first.
The decision: five questions, in order

Start with the ecosystem, because it settles cost and most of the integration story. An organization on Microsoft 365, especially E5, with data in SQL Server, Dynamics, or Fabric, should default to Power BI; the licenses are often already paid for and every integration is native. An organization on Google Workspace with data in Google Analytics, Ads, and BigQuery should default to Looker Studio for the same reasons in reverse. Mixed organizations, which are most of them, move to the next question.
Second, ask who the audience is and what they will do with the numbers. Marketing and growth teams looking at campaign performance are well served by Looker Studio. Finance, operations, and executive reporting where numbers are reconciled, quoted, and audited need Power BI's modeling and governance. Third, ask about data volume and complexity: if the reports need cross-table measures, time intelligence, or more than a few tens of millions of rows without a warehouse behind them, Power BI. Fourth, ask about embedding: product analytics for customers means Power BI Embedded or a dedicated embedded tool, not Looker Studio. Fifth, ask about the team: Power BI needs at least one person who will learn DAX and model design; Looker Studio needs someone who can write SQL in BigQuery. Whichever skill the team has or can hire is a legitimate tiebreaker.
Many mid-size companies land on both, and the article's position is that this is fine as long as the two tools read from the same governed data. Marketing on Looker Studio over BigQuery and finance on Power BI over Fabric is a common and healthy pattern; the failure mode is two tools over two copies of the data producing two answers. Teams building a data analytics and business intelligence practice should decide on the shared data layer before they decide on the tool, which is the subject of the final section.
Which tool first
Which tool should this team start with?
-
Microsoft 365 E5 or data in SQL Server, Dynamics, or Fabric
Power BI
Licenses are often already paid for and every integration is native.
-
Google Workspace with data in Analytics, Ads, or BigQuery
Looker Studio
Free, native connectors, and the audience already lives in Google.
-
Finance or board reporting with reconciled, audited numbers
Power BI
Certified datasets, lineage, row-level security, and DAX time intelligence.
-
Agency or public reporting to audiences without licenses
Looker Studio
Link sharing and scheduled delivery with no per-viewer cost.
-
Embedded analytics inside a customer-facing product
Power BI Embedded, or a dedicated embedded tool
Token-based per-tenant security and capacity pricing; Looker Studio cannot do this.
The layer underneath: why the warehouse decides whether either tool is trusted
Every failed dashboard project one of us has seen failed for the same reason, and it was never the visualization tool. It was that two reports showed different revenue numbers because they pulled from different systems with different definitions, or that the dashboard was fast in the demo and unusable on real data, or that nobody could say where a number came from when a director asked. These are data layer problems: no agreed definitions, no single source, no modeling discipline, no lineage. Power BI hides them inside the model, where a good analyst can fix them; Looker Studio exposes them in the source, where a data engineer has to. Neither tool prevents them.
The durable answer is a governed data layer that both tools can read: a warehouse (BigQuery, Fabric, Snowflake, or a well-run SQL database) with cleaned, conformed tables, agreed metric definitions written down once, and transformation managed as code with tests. On that foundation Power BI models are thin and consistent, Looker Studio reports are fast and trustworthy, and the choice of tool becomes reversible, which is the property that matters most in a market where both vendors change pricing and features every year. This is the work described in the guide to data and AI integration, and it is the same work whichever tool sits on top.
A practical sequence for a company starting from spreadsheets and SaaS exports: pick the warehouse that matches the ecosystem, land the raw data with a managed ingestion tool, model the five or six metrics the business actually argues about as governed tables, and only then build the first dashboards. The dashboards will take a week instead of a quarter, and when the second team wants a different tool, they point it at the same tables. The tool comparison in this article matters; the layer underneath it matters more.
From spreadsheets to a governed layer both tools can trust
-
Choose the warehouse by ecosystemWeek 1
BigQuery for Google shops, Fabric or Azure SQL for Microsoft shops, Snowflake or Databricks when the data team already has one.
-
Land raw data with managed ingestionWeeks 1 to 3
Use a managed connector service for SaaS sources and scheduled loads for databases. Do not hand-write extractors for the first version.
-
Write the metric definitions down onceWeek 2
Revenue, active customer, churn, gross margin: one definition each, agreed by finance and the business, stored with the code.
-
Model the governed tables as codeWeeks 3 to 6
Transformation with tests and version control. Each governed table has an owner and a documented grain.
-
Point the tool at the governed tables onlyWeek 6
Power BI models or Looker Studio sources read from the governed schema, never from raw. Thin models, fast reports.
-
Add the second tool when a team needs itLater
Same tables, same numbers, different presentation layer. The choice stays reversible.
Conclusion: pick by ecosystem and audience, then invest underneath
Power BI and Looker Studio are not two grades of the same tool. Power BI is a modeling platform with enterprise governance that costs per seat and lives best in a Microsoft organization; Looker Studio is a free query-first reporting layer that is superb on Google data and BigQuery and thin everywhere else. The choice follows the ecosystem first, the audience second, then data volume, embedding needs, and the skills the team has. Most mid-size companies that think hard about it end up with Power BI for finance and operations and Looker Studio for marketing, and that is a sound outcome rather than an indecisive one.
What the comparison cannot do is make a dashboard trustworthy. That comes from the warehouse, the definitions, and the modeling discipline underneath, which are the same work whichever logo is on the report. Teams that do that work find the tool decision becomes smaller and reversible; teams that skip it find that neither tool saves them.
- Ecosystem first. Microsoft 365 points to Power BI; Google Workspace points to Looker Studio. Licensing and integration follow.
- Audience second. Reconciled finance numbers need Power BI's modeling and governance; campaign dashboards are happy in Looker Studio.
- Embedding is Power BI's. Customer-facing analytics need token security and capacity pricing that Looker Studio does not offer.
- The warehouse decides trust. Governed tables and written definitions make either tool trustworthy and keep the choice reversible.
Frequently asked questions
Is Looker Studio the same as Google Data Studio?
Yes. Google Data Studio was renamed Looker Studio in October 2022 after Google acquired Looker and brought the two products under one brand. The free tool is Looker Studio; Looker Studio Pro is its paid tier with team workspaces and governance; and Looker, without Studio, is the separate enterprise BI platform with the LookML modeling language. The three are often confused in comparisons.
Is Power BI better than Looker Studio?
It is more capable: richer modeling with DAX, an in-memory engine for large data, mature governance, and a proper embedding path. Whether it is better depends on the job. For a marketing team on Google Workspace reporting on Analytics and Ads, Looker Studio is free, faster to set up, and entirely adequate. For finance, operations, and executive reporting in a Microsoft organization, Power BI is the stronger choice. Many companies use both.
Is Looker Studio really free?
The tool is free for unlimited reports and viewers. The costs are indirect: BigQuery query charges when reports hit a warehouse, paid partner connectors for non-Google data sources, and the analyst or engineering time spent modeling data in the source because the tool does little modeling itself. Looker Studio Pro, at an indicative 9 dollars per user per project per month, adds team workspaces, administration, and support.
How much does Power BI cost?
Power BI Desktop and a personal workspace are free, but sharing requires Pro at an indicative 14 dollars per user per month for both authors and viewers, or Premium per user at about 24 dollars for larger models and more refreshes, or a Fabric capacity starting at a few thousand dollars a month that lets unlimited viewers consume content without individual licenses. Power BI Pro is included in Microsoft 365 E5, so many enterprises already have it. Prices are indicative as of mid 2026.
Can Looker Studio connect to SQL Server or Excel?
Not natively in a first-class way. Looker Studio has native connectors for Google products, BigQuery, Cloud SQL, MySQL, and PostgreSQL, plus a partner connector gallery that includes SQL Server and various file sources, often paid. Excel files can be uploaded or converted to Google Sheets. For Microsoft-centric data the practical routes are a partner connector, replicating the data to BigQuery, or using Power BI, which connects to all of it natively.
Which is better for embedding analytics in a product?
Power BI Embedded. It supports service principal authentication, embed tokens with row-level security applied per customer, a JavaScript SDK, and capacity-based pricing independent of viewer count, which is what a multi-tenant product needs. Looker Studio embedding is an iframe of a shared report with no token-based per-customer security, suitable for public dashboards or a trusted client but not for a product. The full Looker platform and dedicated embedded analytics libraries are the other serious options.
When the dashboard tool matters less than the data layer underneath it, AgileTech is an AI native software development company in Vietnam that builds governed warehouses and models for Power BI and Looker Studio.
Source: https://agiletech.vn/blog/power-bi-vs-looker-studio/ · (c) AgileTech Vietnam. Printed from agiletech.vn.