 Nguyen Manh Thang
Chief Executive Officer, AgileTech Vietnam
Nguyen Manh Thang
Chief Executive Officer, AgileTech Vietnam
- Published
- Read time
- 14 min
- Views
- 84
Read the AI overview
The best business intelligence tool for a mid-size team depends on its data stack, analyst skills, governance requirements, and intended audience. Power BI is a strong default in Microsoft environments, Tableau offers deep visual analysis for analyst-led teams, Looker provides a governed semantic modeling approach suited to shared metrics and embedded analytics, Qlik Sense offers associative exploration for managed enterprise analytics, Metabase is the accessible open-source route for smaller data teams, Apache Superset suits engineering-led organizations that want deployment control, Sigma gives spreadsheet-fluent business users direct warehouse analysis, and Mode serves SQL and notebook-oriented analyst teams. They overlap in dashboarding but differ substantially in modeling, licensing, deployment, technical depth, and embedded analytics. The most expensive mistake is choosing a tool before fixing the underlying data: a polished dashboard cannot correct inconsistent definitions, broken pipelines, missing history, or unreliable source systems, so companies whose reports disagree or whose analysts manually combine exports every week need data engineering before any BI license.
The best business intelligence tool for a mid-size team depends on its data stack, analyst skills, governance requirements, and intended audience, which is why every listicle that opens with a single winner is quietly lying to you. Power BI is a strong default in Microsoft environments, Tableau offers deep visual analysis, Looker provides a governed semantic modeling approach, and Metabase offers the most accessible open-source route. Each of those sentences is true, and none of them answers the question until it meets your data.
This comparison covers the eight tools worth a mid-size team's evaluation time: Power BI, Tableau, Looker, Qlik Sense, Metabase, Apache Superset, Sigma, and Mode. For each one: what it is genuinely good at, and the practitioner caveat the vendor page omits. Then the questions that actually decide the purchase: which alternative fits which reason for leaving Power BI, how to run the selection process, and the section most buyers need most, how to recognize when the company needs data engineering before it needs any BI license at all.
That last point deserves its position in the opening. Choosing a BI tool before fixing the underlying data is the most common and most expensive mistake in this category. A polished dashboard cannot correct inconsistent definitions, broken pipelines, missing history, or unreliable source systems; it renders them in higher resolution. Teams that want the foundation and the dashboards planned as one engagement can see how we structure analytics and BI implementations from the pipeline up.
Key takeaways
- Eight tools cover the mid-size field: Power BI, Tableau, Looker, Qlik Sense, Metabase, Apache Superset, Sigma, and Mode. They overlap in dashboards but diverge sharply in modeling, licensing, deployment, and embedded analytics.
- The simplest tool to demonstrate is not the simplest to operate: governance, source control, permissions, refresh reliability, and dashboard maintenance determine long-term cost far more than the first license price.
- The best Power BI alternative depends on why Power BI is being replaced: Tableau for visual depth, Looker for a semantic layer, Metabase for accessible open source, Superset for engineering control, Sigma for spreadsheet-style warehouse work, Mode for SQL and notebooks.
- Open source is not free operation: self-hosting Metabase or Superset trades license fees for infrastructure, upgrades, monitoring, security patching, and engineering ownership, which can cost more than the commercial product it replaced.
- Evaluate data stack fit before dashboard features, separate internal BI from embedded analytics, and model total operating cost across licenses, capacity, administration, data engineering, training, and migration.
- Buy data engineering before BI when reports disagree, identifiers do not match across systems, history is overwritten, or analysts manually combine exports weekly. A new tool displays the same problems more attractively.
What are the best business intelligence tools in 2026?
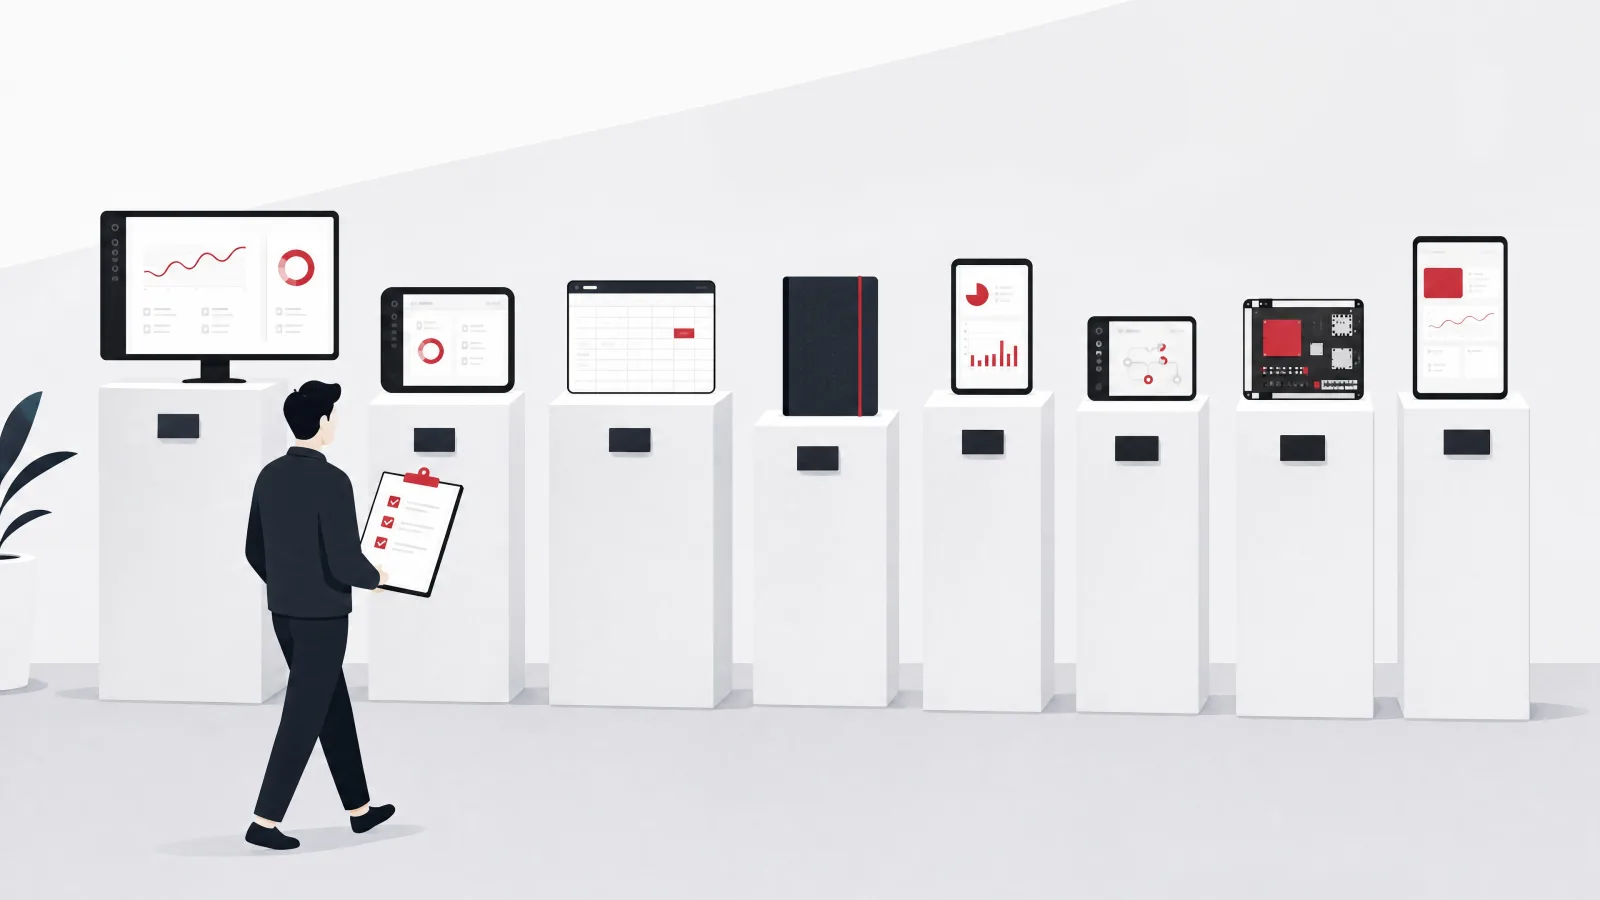
The leading options for mid-size teams are Power BI, Tableau, Looker, Qlik Sense, Metabase, Apache Superset, Sigma, and Mode. They overlap in the obvious capability, dashboards, but differ substantially in modeling approach, licensing style, deployment model, technical depth, and embedded analytics support, and those differences, not the chart galleries, decide whether a tool succeeds in a given organization.
One warning applies to the entire table: the simplest tool to demonstrate is not necessarily the simplest tool to operate. Every product below can produce an impressive dashboard from one clean spreadsheet in a sales call. Governance, source control, deployment, permissions, refresh reliability, and dashboard maintenance are what determine the long-term cost, and they are invisible in the demonstration by design.
The eight BI tools at a glance
| Tool | Best for | Licensing style | Learning curve |
|---|---|---|---|
| Power BI | Microsoft-centered organizations | Free entry plus paid user and capacity models | Low to medium basic, high for advanced modeling |
| Tableau | Visual analysis and analyst-led exploration | Commercial role and capacity-based options | Medium |
| Looker | Governed metrics and embedded analytics | Commercial platform licensing | High |
| Qlik Sense | Associative exploration, managed enterprise analytics | Commercial subscription and capacity options | Medium to high |
| Metabase | Accessible internal BI, smaller data teams | Open-source self-hosting plus paid cloud and enterprise | Low to medium |
| Apache Superset | Engineering-led open-source visualization | Open-source, self-managed | Medium to high |
| Sigma | Cloud warehouse analysis, spreadsheet-style interface | Commercial subscription | Medium |
| Mode | SQL, Python, R, notebooks, analyst collaboration | Commercial plans with accessible entry options | Medium to high |
Learning curve describes the path to governed production use, not the first demo dashboard.
Power BI and Tableau: the default and the specialist

Power BI is Microsoft's business intelligence platform for data modeling, reporting, dashboards, and organizational sharing, and it is usually the strongest starting point for teams already standardized on Microsoft data and productivity products. It suits internal operational dashboards, finance and management reporting, self-service analysis under central governance, teams fluent in Excel concepts, and distribution through Microsoft workplace tools. The surrounding ecosystem is its real advantage: identity, collaboration, data services, and administration fit together more naturally than a collection of unrelated tools ever will. Licensing spans free individual entry points, paid per-user tiers, and capacity-oriented models, and the correct cost estimate covers creators, viewers, sharing, refresh frequency, and capacity rather than the first license alone.
The practitioner caveat: Power BI looks simple when the demonstration begins with one clean spreadsheet, and becomes demanding exactly when production does, reusable measures, row-level security, deployment controls, refresh reliability, and consistent semantic models. Its expression language and data transformation tooling require genuine specialist knowledge for advanced use, and an ungoverned team can create dozens of reports that each calculate the same business metric differently within a quarter. Power BI is also less automatic when the organization is not invested in Microsoft infrastructure; it still works, but the ecosystem advantage that justified the default shrinks. The decision rule: use Power BI when Microsoft alignment is real and the team is willing to govern shared datasets and measures.
Tableau, owned by Salesforce, is the visual analytics specialist, strongest for analyst-led exploration, rich visualization, and interactive dashboard craft. It fits teams that need flexible visual exploration, advanced dashboard design, analyst-driven discovery, interactive executive reporting, and broad source connectivity, and an experienced Tableau analyst can explore data and build a sophisticated visual explanation without waiting for a custom application. Licensing is commercial with role-based and capacity options across cloud and server products, and the estimate must separate creator seats from broad viewing before the numbers mean anything.
Tableau's caveat is that visual flexibility creates governance debt on a schedule: different analysts build similar calculations, filters, and sources with slightly different logic, and speed produces dashboard sprawl wherever ownership and certification are unclear. The full cost includes authors, explorers, viewers, administration, and the engineering work needed to prepare trustworthy data, because Tableau does not remove the need for a warehouse or a semantic strategy. Choose it when analyst depth and visual exploration genuinely justify the licensing and governance investment, not because its demos are the prettiest, though they are.
Looker and Qlik Sense: the semantic layer and the associative engine
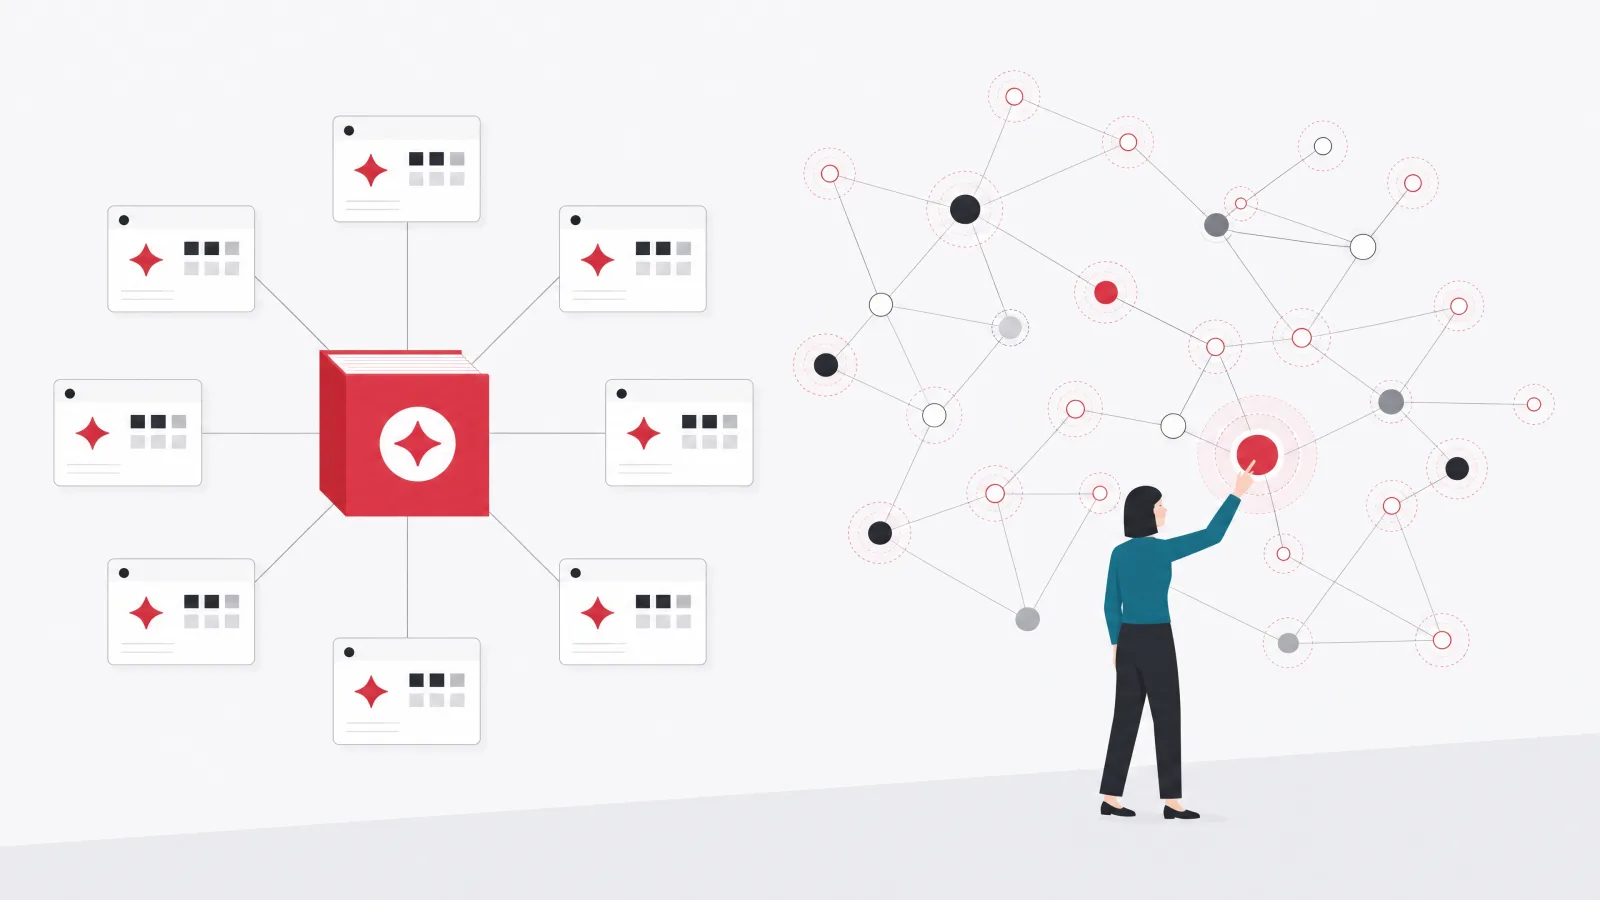
Looker, Google Cloud's BI and data application platform, is distinguished by a governed semantic modeling layer built with LookML. Measures and dimensions are defined once, in version-controlled code, so every report that uses recognized revenue or active customer uses the same logic, which is precisely the discipline most mid-size reporting stacks lack. It is a strong fit for centralized metric definitions, cloud warehouse environments, governed self-service, embedded customer-facing analytics, data applications, and any team willing to fund version-controlled analytics development. Procurement follows a commercial platform model rather than a low-cost self-service license, so the evaluation must cover platform access, user types, embedded use, support, and cloud commitments.
Looker's caveat is that governance strength is purchased with modeling work: someone must define, review, test, and maintain LookML permanently, and business users do not automatically gain useful self-service because a semantic layer exists. The model must reflect how users actually ask questions, and the interface must expose the right fields without drowning people in every field. Looker is genuinely excessive for a small team that needs a handful of internal dashboards, and genuinely compelling when shared metrics, embedded analytics, and reusable models are strategic requirements. The decision rule: choose Looker when the organization values governed metrics enough to fund ongoing analytics engineering.
Qlik Sense takes a different route to insight: an associative engine that lets users explore relationships across data, including what is connected and what is excluded, without building a new query for every path. It fits organizations needing guided and exploratory dashboards across several business sources, managed enterprise analytics, strong administrative control, and Qlik's broader data integration capabilities. Licensing spans cloud subscription tiers and enterprise arrangements involving users, capacity, data volume, and deployment, so current commercial terms should be validated against expected use rather than assumed from a price page.
Qlik's caveats are practical rather than technical. Its expertise is scarcer in many hiring markets than Power BI or general SQL skills, which affects implementation, support, and staff replacement, and its data model and application development approach require real training: a dashboard performs poorly when data structures, expressions, or reload processes are designed casually. The rule that protects buyers here: do not select Qlik because an interactive demonstration feels different. Test it with the organization's actual data volume, real user questions, its security model, and the administrators who will run it.
Metabase and Apache Superset: the two open-source routes

Metabase is the accessible open-source option: a BI platform designed to make database questions, charts, dashboards, and internal analytics available without a large BI program. It is a strong fit for startups and mid-size teams, internal operational dashboards, straightforward SQL databases, and organizations where analysts and business users need to share one platform quickly; its approachable interface reliably moves teams from ad hoc database queries and spreadsheet exports into shared reporting. An open-source edition sits alongside paid cloud and enterprise plans, and self-hosting removes license expense without removing operating cost.
That distinction is Metabase's core caveat: open source is not free operation. Self-hosting means infrastructure, upgrades, backups, monitoring, email configuration, security patches, and incident response, owned by someone with a name. Advanced governance, embedding, authentication, and administration needs tend to pull organizations toward the paid editions or toward additional engineering, and Metabase cannot repair a poorly structured source database: pointing it directly at transactional systems produces slow dashboards and exposes unstable business definitions. Choose it when fast internal BI and manageable complexity matter more than specialized visual design.
Apache Superset is the other open-source route, and a different proposition entirely: a data exploration and visualization platform best suited to organizations with technical teams that want broad visualization capability without a proprietary license model. It fits engineering-led data organizations, SQL-capable analysts, teams requiring deployment control, and platforms needing custom authentication or deep integration. Superset is self-managed software; third parties offer managed services, but the Apache project itself is not a hosted BI subscription, and evaluating it as one leads to disappointment on a schedule.
Superset's caveat is that it needs engineering ownership as a standing commitment: production operation includes deployment, metadata database management, caching, background workers, authentication, upgrades, monitoring, and security maintenance. The interface can serve business users, but it is not a no-training environment, and dataset preparation, permissions, and dashboard conventions still need governance. The honest accounting: a company choosing Superset to avoid license fees may spend more on engineering than the commercial product would have cost, and that can still be the correct tradeoff when control and customization genuinely matter. The decision rule: choose Superset when the organization deliberately wants to own the platform, not merely because the software can be downloaded.
What self-hosted open-source BI actually requires
Sigma and Mode: the spreadsheet bridge and the analyst workbench
Sigma is a cloud analytics platform that puts a spreadsheet-style interface over governed warehouse data, letting business users analyze with familiar concepts while computation stays connected to cloud data infrastructure. It is a practical fit for teams comfortable in spreadsheets, cloud warehouse environments, business users who need detailed exploration rather than fixed dashboards, collaborative analysis, operational applications on governed data, and embedded analytics. Its genuine contribution is lowering the transition barrier for users who find traditional BI builders restrictive or overly technical, which describes a large share of the people BI is nominally for.
Sigma's caveat: a familiar interface does not eliminate data governance. Users still need trusted tables, metric definitions, access controls, and documented business logic, and Sigma is most compelling when a cloud warehouse already exists and contains usable data. It is far less useful while information remains fragmented across spreadsheets, application databases, and manual exports, the exact condition many evaluating teams are in. Test real workflows rather than dashboard creation: the deciding question is whether business users can answer recurring questions without spawning uncontrolled calculation variants.
Mode is the analyst workbench of the list: a collaborative platform combining SQL, Python, R, notebooks, visualization, and reporting, aimed at data teams that investigate questions and publish results. It fits SQL-oriented analytics teams, data scientists working in Python or R, collaborative investigations, reproducible analytical reports, and the common workflow where ad hoc analysis hardens into shared reporting. The platform's value is continuity, query, notebook, and publication in one place, without moving work across disconnected tools.
Mode's caveat mirrors its strength: it is more natural for technical analysts than for casual dashboard consumers, and a finance manager wanting drag-and-drop reporting will need more support than an SQL analyst. Notebook flexibility also creates a maintenance liability, because important reporting logic can end up distributed across SQL, Python, and report definitions with no clear owner. Choose Mode when analyst productivity and investigation matter more than giving every employee a simple dashboard builder, and pair it with ownership conventions from day one.
Which BI tool is the best Power BI alternative?
The best Power BI alternative depends entirely on why Power BI is being replaced, which is the question most alternative roundups skip. Tableau is the strong option when the need is deeper visual exploration, Looker when the need is a centralized semantic layer, Metabase when the goal is accessible open-source internal BI, Superset when engineering wants controlled open-source deployment, Sigma when spreadsheet-fluent users need direct warehouse analysis, Mode when the team runs on SQL and notebooks, and Qlik Sense when associative exploration is the missing capability. The table maps each reason to its alternative and to the tradeoff that arrives with it.
Two cautions before any migration is approved. First, replacing Power BI because one dashboard is difficult is rarely sufficient justification: determine whether the real problem is the data model, skills, licensing, governance, or platform fit, because four of those five problems travel with the team to the new tool. Second, migration has a real cost that never appears in the comparison spreadsheet: reports, measures, permissions, refresh processes, training, and operational routines must all be rebuilt, and the organization pays that cost in analyst months while normal reporting continues.
Power BI alternatives by reason for leaving
| Reason for replacing Power BI | Strong alternative | Main tradeoff |
|---|---|---|
| Need deeper visual exploration | Tableau | Commercial cost and governance effort |
| Need a centralized semantic layer | Looker | Higher modeling and implementation effort |
| Want open-source internal BI | Metabase | Less advanced governance in basic deployments |
| Want engineering-controlled open source | Apache Superset | Higher operating burden |
| Need spreadsheet-style warehouse analysis | Sigma | Requires a suitable cloud data foundation |
| Need SQL and notebook collaboration | Mode | More technical user profile |
| Need associative exploration | Qlik Sense | Specialist skills and commercial complexity |
Confirm the problem is the platform before paying the migration cost. Most reporting problems travel with the team.
How should a mid-size team choose a BI tool?

Evaluate data stack fit before comparing dashboard features, because the most visually impressive tool fails if it does not match the data architecture or the people expected to use it. Start by locating where reliable data currently lives: transactional databases, a cloud warehouse, a data lake, SaaS applications, spreadsheets, event platforms, manually prepared files. A warehouse-centered tool performs best when the warehouse contains modeled, governed information; direct-source BI starts faster but pushes complex reporting load onto production systems and faithfully reproduces every inconsistent definition it finds there.
Next, identify who will actually build dashboards, because executives, operational managers, analysts, and data engineers need different tools. If a small analyst team builds everything, SQL and modeling depth matter more than drag-and-drop simplicity; if department users create their own reports, discoverability, permissions, and guardrails become central. The phrase self-service deserves precision here: it should not mean everyone creates separate definitions, it should mean users can answer appropriate questions within governed data boundaries. Then separate internal BI from embedded analytics, because they are different products wearing the same demo. Embedded requirements include tenant isolation, application authentication, white-label branding, usage-based performance, customer-specific filtering, API control, export restrictions, and external service commitments, and a strong internal dashboard tool is not automatically a strong embedded platform. Evaluate embedding as a product capability, never as an iframe demonstration.
Finally, test total operating cost, the number the license page is designed to hide. It includes licenses, cloud capacity, platform administration, data engineering, analytics engineering, dashboard development, training, support, security, migration, and maintenance. Open-source software reduces license cost while increasing engineering cost; commercial software reduces infrastructure ownership while introducing user or capacity charges that scale with success. The correct decision minimizes the cost of reliable decisions, not the price of one license, and teams that want the evaluation run against their actual stack rather than a vendor's demo data can bring us in for the analytics platform assessment before any contract is signed.
The BI selection checklist
- Data stack fitDoes the tool match where governed data actually lives today, warehouse, lake, or application databases?
- Builder profileWill a central analyst team or distributed department users build reports? Depth versus guardrails follows from the answer.
- Governance modelWhere do metric definitions live, who certifies dashboards, and can the tool enforce that, not just permit it?
- Internal versus embeddedIf analytics will face customers, evaluate tenant isolation, authentication, branding, and API control as product features.
- Total operating costLicenses plus capacity, administration, data and analytics engineering, training, migration, and maintenance over three years.
- Proof with real dataPilot with the organization's actual sources, actual questions, and actual users before any commitment.
Run every candidate through all six. A tool that fails the data stack question fails everything downstream.
When does a company need data engineering before BI?
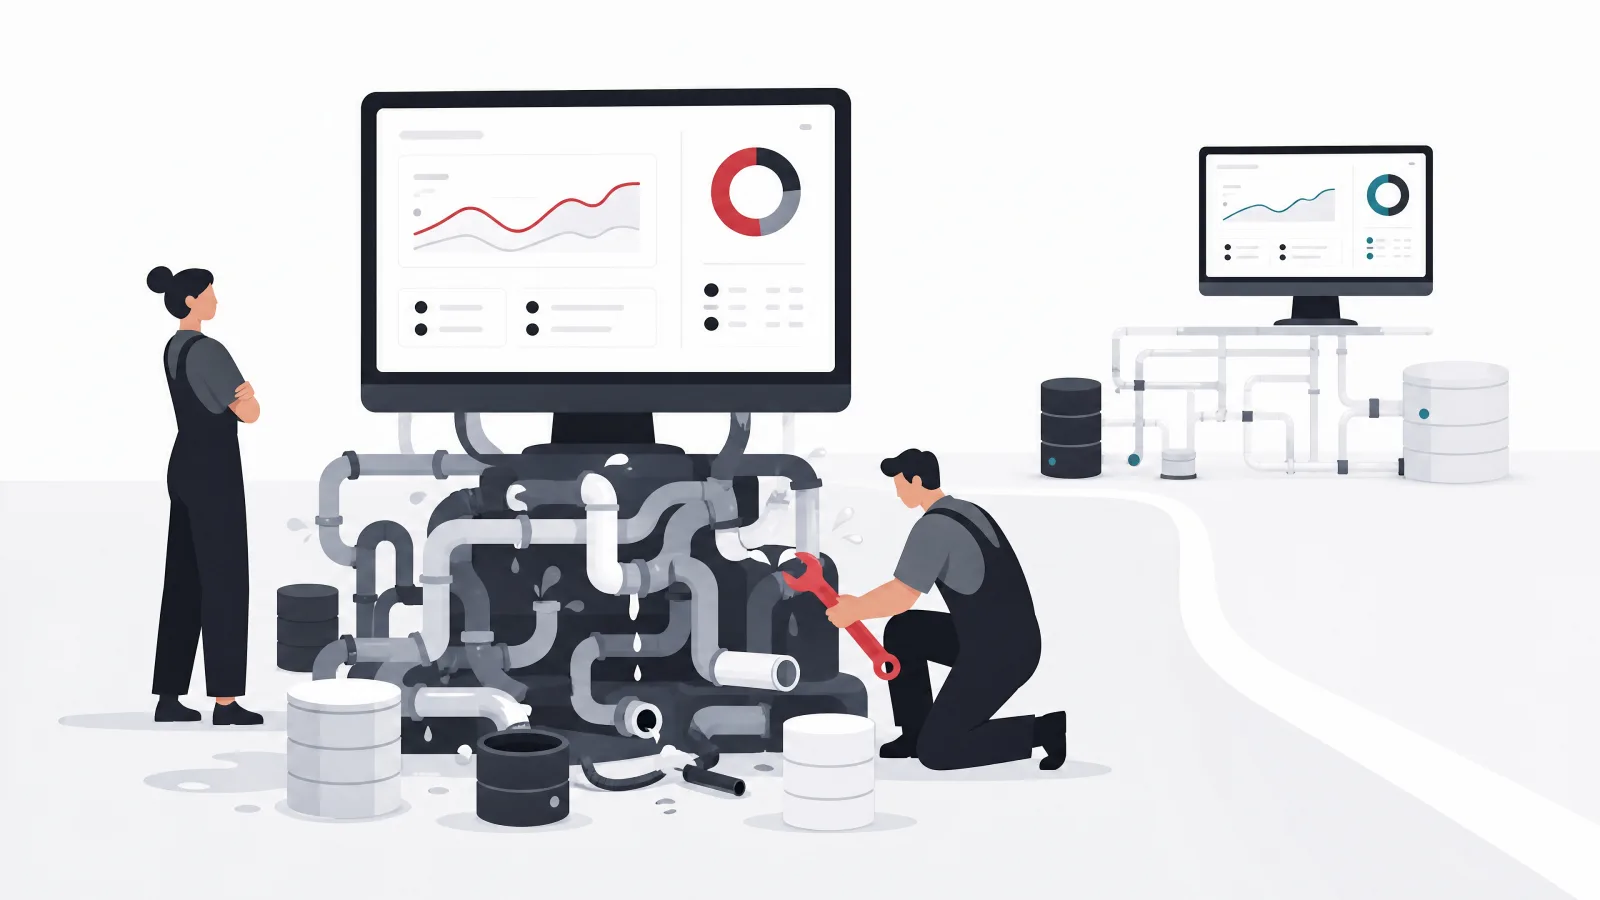
A company needs data engineering first when reports disagree, source systems are unstable, historical data is missing, or dashboards require repeated manual preparation. A new BI tool will otherwise display the same underlying problems more attractively, at a higher monthly cost, with a fresh logo. The warning signs are specific and worth reading as a diagnostic: different departments report different revenue totals, customer identifiers fail to match across systems, historical records get overwritten, analysts manually combine exports every week, production queries slow customer applications, metric definitions exist only inside individual dashboards, source fields change without notice, and access rules are applied inconsistently. Two or more of those signs mean the foundation, not the dashboard layer, is the constraint.
The practical foundation for a mid-size company is not the most complex data platform on the market. It is a source system inventory, automated extraction and loading, a central warehouse or analytical store, data quality checks, transformation and modeling, shared metric definitions, role-based access, and monitoring with named ownership. That list is achievable in a quarter for most mid-size stacks, and it multiplies the value of whichever BI tool is chosen afterward, because every tool on this page performs dramatically better over modeled, governed data. The same foundation is what makes later ambitions realistic, the path from reporting to prediction that our data and AI integration guide maps in detail.
This is why the right engagement is often data engineering rather than a dashboard project, and why the first deliverable of a good analytics partner is frequently a reliable orders model or customer model rather than a chart. Dashboards built on that model take days instead of months, agree with each other by construction, and survive tool migrations because the logic lives in the warehouse rather than in each report. Buying the dashboard first and the foundation later reverses the compounding: every report built on unmodeled data is rework waiting for a schedule.
Dashboard project or data engineering first?
Do reports from different departments already agree on core numbers?
-
Yes, definitions are consistent and pipelines are stable
Proceed to BI selection
The foundation exists. Tool fit, builder profile, and operating cost are the real questions now.
-
No, totals disagree or analysts merge exports by hand
Data engineering engagement first
Every tool on this page will render the disagreement in higher resolution. Fix definitions and pipelines, then choose.
-
Unsure, nobody can say where definitions live
Two-week data audit before anything
An inventory of sources, definitions, and manual steps costs little and decides the sequence with evidence.
The answer decides the next quarter's budget line, so answer it before the vendor calls start.
Frequently asked questions
What are the best business intelligence tools in 2026?
Strong options for mid-size teams include Power BI, Tableau, Looker, Qlik Sense, Metabase, Apache Superset, Sigma, and Mode. The best choice depends on the data stack, user skills, governance model, embedding needs, and budget structure, because the tools overlap in dashboarding but differ substantially in modeling, licensing, deployment, and technical depth.
What is the best BI tool for a mid-size company?
Power BI is a strong default for Microsoft-centered organizations, Metabase fits smaller data teams wanting accessible open-source BI, Tableau suits analyst-led visual analysis, and Looker fits organizations investing in governed semantic models and embedded analytics. The deciding factors are where governed data lives, who will build reports, and the total operating cost rather than the license price.
What are the best Power BI alternatives?
Tableau, Looker, Qlik Sense, Metabase, Apache Superset, Sigma, and Mode are all credible alternatives. The right one depends on why Power BI is being replaced: Tableau for deeper visual exploration, Looker for a centralized semantic layer, Metabase or Superset for open-source routes, Sigma for spreadsheet-style warehouse analysis, Mode for SQL and notebook collaboration, and Qlik Sense for associative exploration.
Is open-source business intelligence software free?
Open-source BI may not require a commercial license, but production operation still costs money. Self-hosting Metabase or Superset means paying for hosting, monitoring, upgrades, backups, security patching, authentication, and engineering support, with a named owner for incidents. Organizations regularly spend more operating a free tool than they would have spent licensing a commercial one, which can still be the right tradeoff when control matters.
Is Tableau better than Power BI?
Tableau is often the better fit for analyst-led visual exploration and sophisticated dashboard craft, while Power BI is usually more natural in Microsoft-centered environments where identity, collaboration, and data services already fit together. Neither is universally better; the decision should rest on the actual data stack, the builders, licensing structure, and governance requirements, tested with the organization's real data rather than demo files.
Do we need a data warehouse before using a BI tool?
Not always, but a warehouse becomes valuable as soon as data comes from several systems, history must be preserved, or metrics need consistent definitions across departments. Direct-source dashboards work for simple reporting against one stable database, but they push analytical load onto production systems and reproduce inconsistent definitions as usage grows, which is why most mid-size BI programs succeed or fail on the data foundation rather than the tool.
When the dashboards need a data foundation under them, AgileTech is an AI native software development company in Vietnam that builds the pipelines, models and BI layers as one system.
Source: https://agiletech.vn/blog/best-business-intelligence-tools/ · (c) AgileTech Vietnam. Printed from agiletech.vn.