 Nguyen Manh Thang
Chief Executive Officer, AgileTech Vietnam
Nguyen Manh Thang
Chief Executive Officer, AgileTech Vietnam
- Published
- Read time
- 14 min
- Views
- 85

Read the AI overview
In 2026 the major streaming services have converged on the same three-tier structure: an ad-supported plan in the range of roughly 8 to 12 dollars a month, an ad-free standard plan around 15 to 19 dollars, and a premium plan around 20 to 25 dollars that adds 4K, more simultaneous streams, and better audio. The differences that actually decide the choice are the catalog, whether the service is bundled with something you already pay for (Amazon Prime, a mobile carrier, the Disney and Hulu and Max bundle, YouTube Premium with Music), how many screens a household needs at once, and whether downloads for travel matter. A single viewer who tolerates ads can cover two services for under 20 dollars; a family that wants ad-free 4K on four screens across two services is now paying 40 to 50 dollars, which is why bundles and rotation (subscribing for a season, then canceling) have become the dominant consumer strategies. Prices in this chart are indicative and rounded; confirm the current figure on the service's own page.
There are more streaming services than there were cable channels most of us actually watched, and each has quietly rebuilt its pricing around the same three tiers while raising the price of every one of them. Comparing them means holding a lot of numbers in your head at once: the monthly price at each tier, whether the cheap tier has ads, how many people can watch at the same time, whether you can download for a flight, whether 4K costs extra, and whether the thing is already bundled into something you pay for.
This chart puts those variables side by side for the nine services most households in the United States and much of the English-speaking world are choosing between: Netflix, Disney+, Hulu, Max, Prime Video, Apple TV+, Paramount+, Peacock, and YouTube Premium. It then works through the questions that decide the choice for different kinds of households, from the single viewer who does not mind ads to the family that wants everything ad-free on four screens.
It is also written for a second reader. The streaming market is the most visible laboratory in the world for subscription pricing, ad-supported tiers, and bundling, and product teams building any subscription product, media or otherwise, can read the same chart as a set of pricing experiments with public results. Teams that build subscription and media products will find the last sections aimed at them.
Key takeaways
- Every major service now sells three tiers: with ads, without ads, and premium. The ad tier is the growth product, and it is where the price competition happens.
- Sticker prices have risen 30 to 60 percent since 2022 across the board, and password-sharing enforcement means the effective price per household rose further.
- The bundle is the new discount. Disney+ with Hulu, the Disney and Max bundle, Prime Video inside Prime, and YouTube Premium with Music each undercut buying the parts separately by a wide margin.
- Simultaneous streams and download limits, not catalog, are what separate the standard tier from premium for most households, and they are the most-missed line on any chart.
- Rotation beats accumulation. Subscribing to a service for the months its must-watch show is airing, then canceling, costs a fraction of holding five subscriptions year-round.
- For product teams, the chart is a case study in tiering, ad-supported economics, and bundling that transfers directly to any subscription product.
The chart: nine services, one table
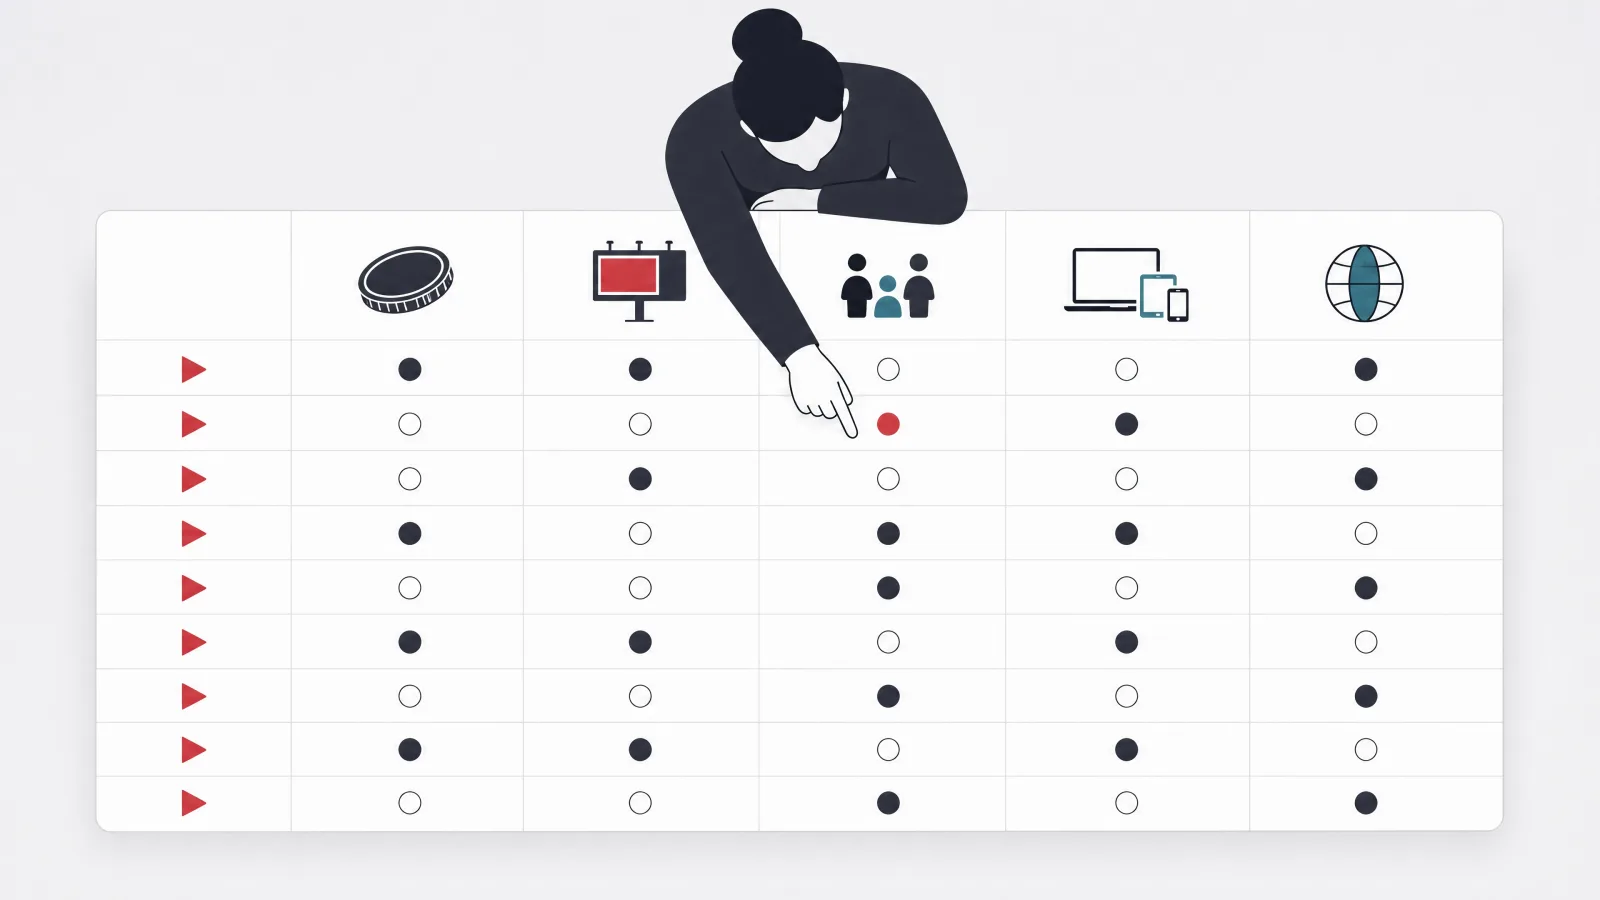
The table below is the core of the article. Prices are indicative monthly figures in US dollars as of mid 2026, rounded to the dollar, and they will drift; every service in the list has raised prices at least twice since 2022 and several have done so annually. Treat the table as the shape of the market and confirm the exact number on the service's own plan page before subscribing. Annual plans, where offered, generally save the equivalent of one to two months.
Three columns matter more than the price itself. Simultaneous streams determines whether a couple, a family, or a shared household can actually use one subscription. Downloads determine whether the service is useful on a plane or a commute without data. And the bundle column tells you whether you might already be paying for it, or could pay much less for it alongside something else. Catalog is deliberately not a column, because it is the one variable that cannot be reduced to a cell and it changes monthly; the section on choosing by household handles it instead.
One structural note before reading the rows. Netflix and Disney+ pioneered the ad tier as a cheaper entry point in late 2022, and within two years every service on this list except Apple TV+ had one. The ad tier is now where subscriber growth comes from, and services have been steering customers toward it by holding its price steady while raising the ad-free tiers, and in some cases by retiring the cheapest ad-free plan for new customers entirely. If a price on the chart looks like a bargain, it is almost certainly the ad tier.
Streaming service comparison chart, mid 2026, indicative US prices
| Service | With ads | Ad-free | Premium | Streams (std / prem) | Downloads | Notable bundle |
|---|---|---|---|---|---|---|
| Netflix | ~8 | ~18 | ~25 | 2 / 4 | Yes, all paid tiers | Carrier and ISP bundles in some markets |
| Disney+ | ~10 | ~16 | ~19 (4K, in bundle) | 4 / 4 | Yes, ad-free tiers | Disney+, Hulu, and Max bundle |
| Hulu | ~10 | ~19 | Live TV from ~83 | 2 / unlimited home | Yes, ad-free tier | Disney bundle; Live TV bundle |
| Max | ~10 | ~17 | ~21 (4K) | 2 / 4 | Yes, ad-free tiers | Disney+, Hulu, and Max bundle |
| Prime Video | Included in Prime (~15) | +~3 to remove ads | Add-on channels | 3 / 3 | Yes | Inside Amazon Prime |
| Apple TV+ | None | ~13 | None | 6 / 6 | Yes | Apple One bundle |
| Paramount+ | ~8 | ~13 (with Showtime) | None | 3 / 3 | Yes, ad-free tier | Walmart+ includes ad tier |
| Peacock | ~8 | ~14 | None | 3 / 3 | Yes, ad-free tier | Some Comcast and Instacart plans |
| YouTube Premium | Free tier with ads | ~14 (with Music) | Family ~23 | 1 account / 5 family | Yes | YouTube Music included |
Indicative monthly prices rounded to the dollar; confirm on the service's plan page. Streams and download figures are for the standard ad-free tier unless noted. Apple TV+ has no ad-supported plan.
Where the free and ad-supported options fit

Free is not absent from this chart, it is just spread around it. YouTube is free with ads for the largest video catalog on earth, Peacock and Paramount+ have periodically offered free tiers or long promotions, and outside the nine services here, ad-supported free platforms such as Tubi, Pluto TV, the Roku Channel, and Freevee carry deep libraries of older films and shows at zero cost. For a household whose viewing is mostly background television and older catalog rather than the newest original series, the honest answer is that one paid ad-supported service plus the free platforms covers most of it.
The paid ad tiers occupy a specific niche. They cost roughly half the ad-free price, carry a few minutes of advertising per hour (typically four to five, well under broadcast television's fifteen to eighteen), and in most cases include the full catalog with a small number of licensed titles excluded. The trade-offs to check are downloads, which some services withhold from the ad tier, and simultaneous streams, which are sometimes capped lower. Netflix's ad tier, for example, gained downloads only after launch, and several services restrict the ad tier to two concurrent streams.
For product teams, the ad tier is the most important development in subscription media in a decade and its logic transfers. Services discovered that a meaningful share of people would never pay 18 dollars but would pay 8, that advertising revenue per ad-tier subscriber roughly closed the gap, and that the ad tier reduced churn because the price felt tolerable to keep. The principle, which the article on how free apps make money covers from the app side, is that an ad-funded entry tier expands the paying base rather than cannibalizing it, provided the ad-free tier remains clearly better.
Price inflation, password sharing, and the effective cost

The sticker prices in the chart understate what has happened to the cost of streaming. Between 2022 and 2026 the ad-free standard tier at most services rose by 30 to 60 percent, premium tiers rose further, and the cheapest ad-free plan was withdrawn from new customers at several services, forcing anyone who wanted no ads onto a more expensive plan. The ad tiers, by contrast, have moved little. The effect is a market that has been pushing every price-sensitive customer toward advertising while extracting more from everyone who refuses it.
Password-sharing enforcement compounds this. Netflix began requiring that all users of an account live in the same household in 2023, offering paid extra-member slots at a few dollars each, and Disney+, Hulu, and Max followed. For the many households that had been splitting one subscription across two or three homes, the effective cost per home doubled or tripled overnight, and the enforcement is generally credited with adding tens of millions of paying accounts. It is the single largest reason the total spend per household on streaming has risen faster than any headline price.
The arithmetic for a household is therefore not the chart's price column but the price of the tier that actually delivers what the household needs, multiplied across the services it holds at once, with extra-member fees added where sharing used to be free. A family that in 2022 held Netflix, Disney+, and Max ad-free for around 35 dollars, and shared Netflix with a relative, may in 2026 be paying over 60 dollars for the same viewing with an extra-member slot. That gap is what the bundle and rotation strategies in the next sections exist to close.
Bundles: the discount that replaced the discount
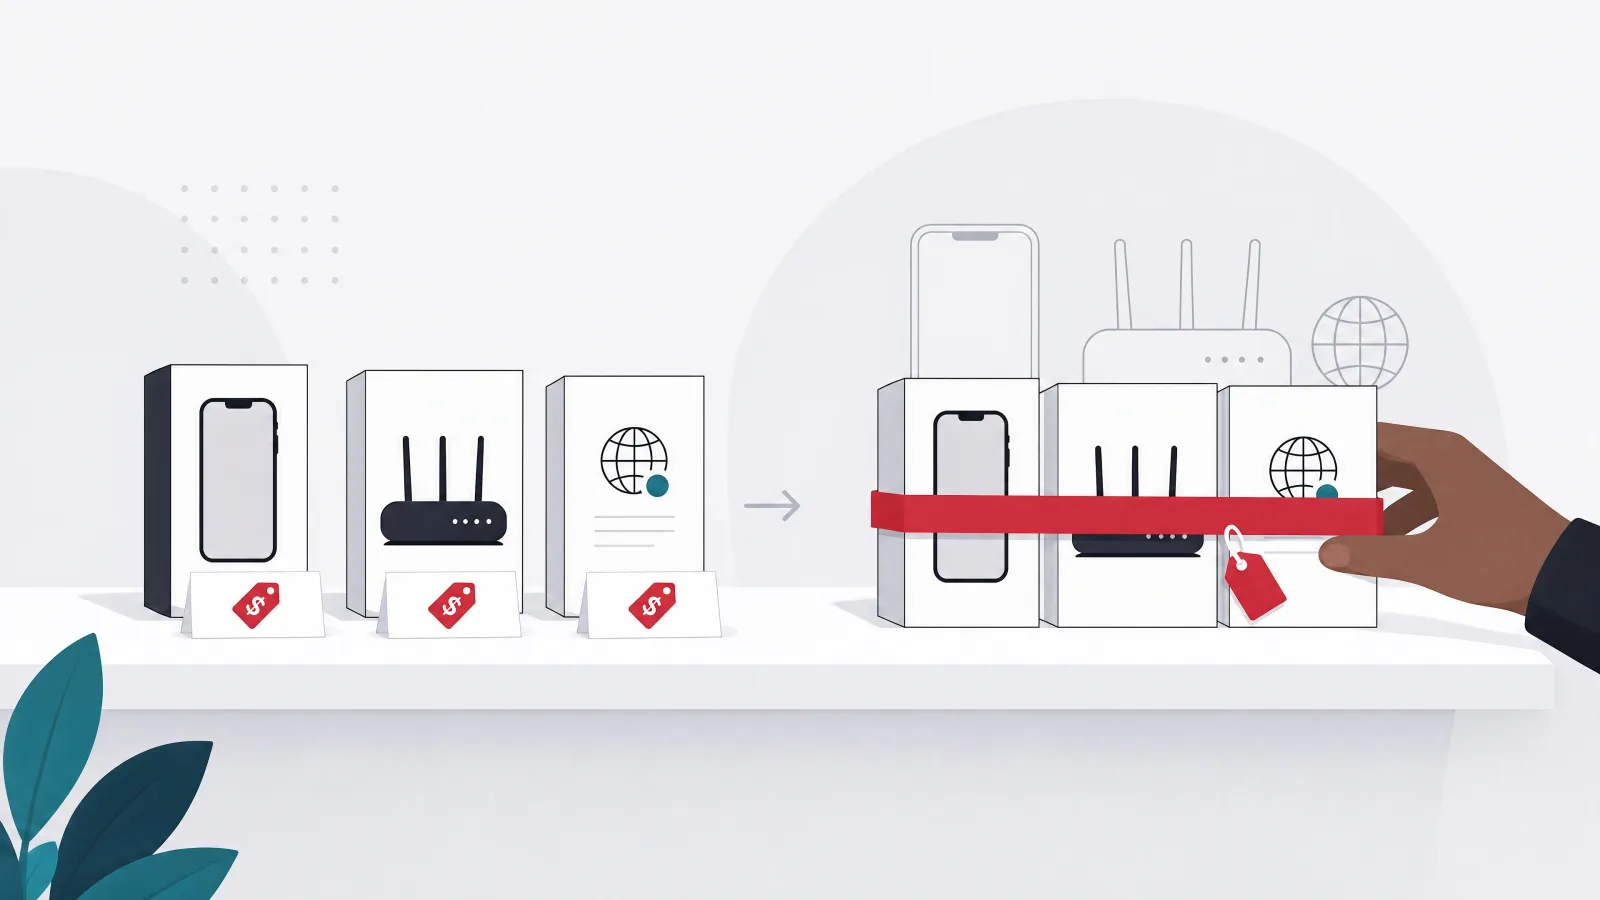
Once every service had raised prices, the discounting moved into bundles. The Disney bundle of Disney+ and Hulu, with ads, costs roughly the price of one and a half of them; the three-way bundle adding Max saves more still against buying all three. Prime Video is bundled inside Amazon Prime, so tens of millions of households have it whether they watch it or not. Apple TV+ sits in Apple One alongside Music, iCloud storage, and Arcade. YouTube Premium includes YouTube Music, which is a full music streaming service for the same price competitors charge for music alone. And mobile carriers and internet providers in many markets bundle Netflix, Disney+, or Max into their higher plans at what amounts to a steep discount.
The bundle logic is simple from the seller's side: bundled subscribers churn far less, because canceling means losing several things at once, and the bundle gives a large service a way to prop up a smaller one. For the household it means the comparison is no longer service against service but bundle against bundle, and the right question is which set of services you would want anyway, and whether a bundle happens to contain most of it. A household that wants Disney+ for the children and Max for the adults should almost never buy the two separately.
The trap is paying for a bundle because it is a good deal on things you do not watch. A bundle that saves 8 dollars a month against separate prices but includes one service you would never have subscribed to alone is not a saving; it is 10 dollars a month for something you did not want. The chart below shows indicative savings for the common bundles against buying the parts, and the honest way to read it is to first list the services you would buy individually, then see whether any bundle covers that list.
Common bundles against buying the parts, indicative
| Bundle | Includes | Bundle price | Parts bought separately | Indicative saving |
|---|---|---|---|---|
| Disney bundle, with ads | Disney+, Hulu | ~11 | ~20 | ~9 |
| Disney, Hulu, Max, with ads | Disney+, Hulu, Max | ~17 | ~30 | ~13 |
| Disney, Hulu, Max, ad-free | Disney+, Hulu, Max | ~30 | ~52 | ~22 |
| Amazon Prime | Prime Video plus shipping, music, more | ~15 | Video alone not sold separately at scale | Depends on Prime use |
| Apple One, individual | Apple TV+, Music, Arcade, 50 GB iCloud | ~20 | ~30 | ~10 |
| YouTube Premium | Ad-free YouTube, YouTube Music | ~14 | Music services alone ~11 | Ad-free video for ~3 over a music plan |
Indicative monthly figures. The saving is only real if you would have bought every included service on its own.
Choosing by household: five profiles
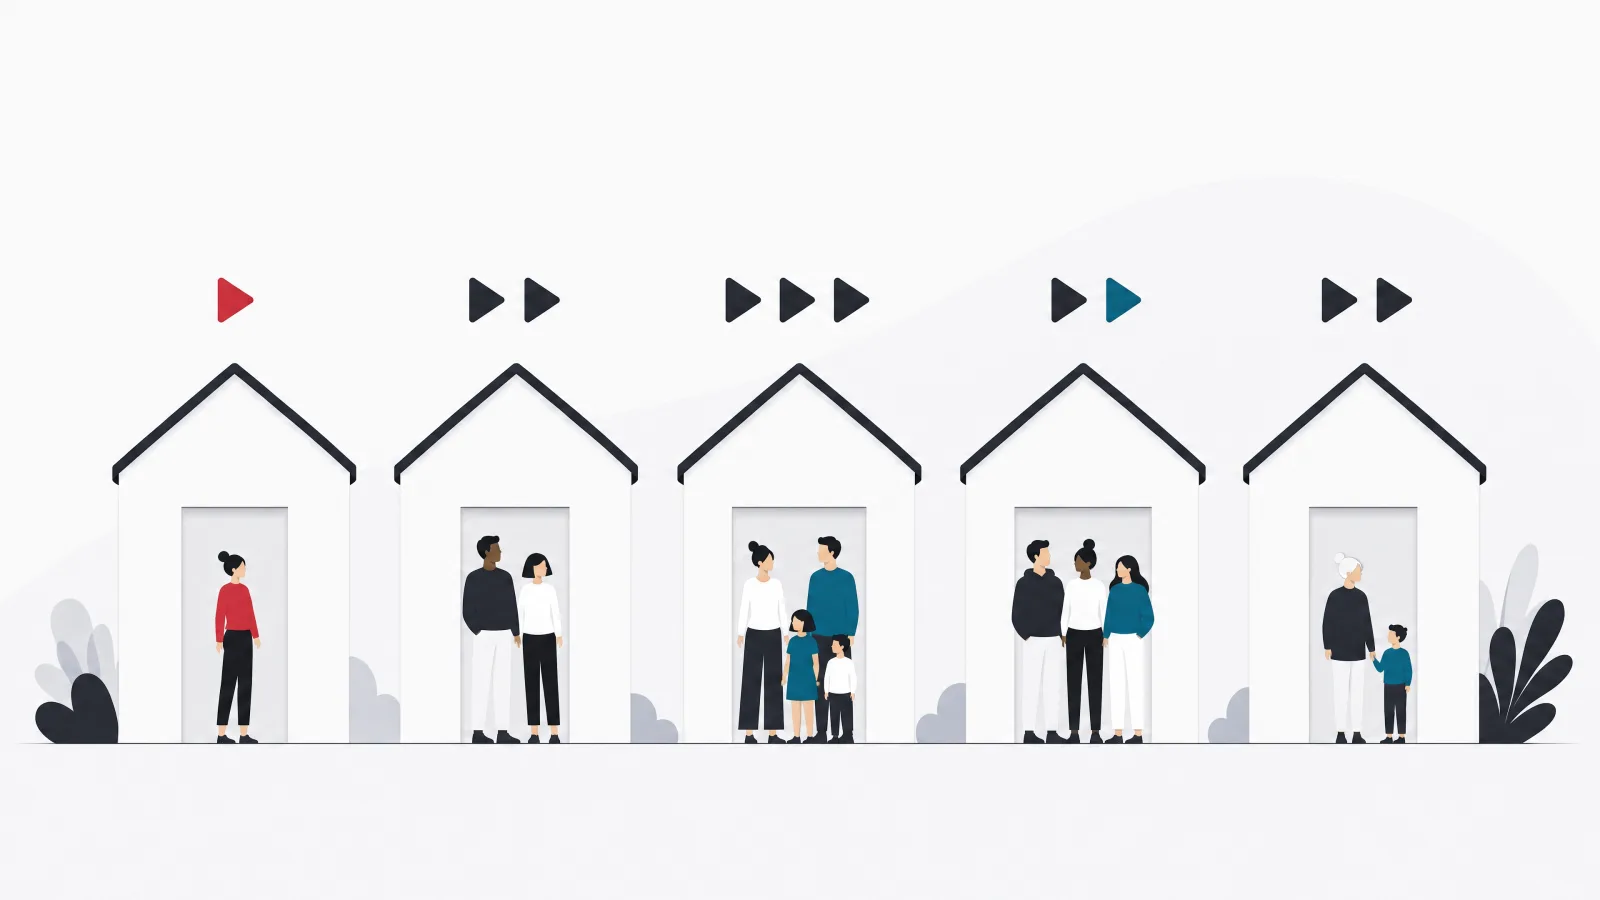
The chart answers a different question for every household, so here are five common profiles worked through. The single viewer who tolerates ads has the easiest time: two ad-supported services, rotated with what is airing, plus the free platforms, comes in under 20 dollars and covers nearly everything. The catalog question decides which two, and for most people the answer is Netflix plus whichever of Max, Disney+, or Prime carries the shows they actually talk about.
The couple who want no ads and watch different things needs two simultaneous streams, which every ad-free standard tier provides, and probably two or three services. This is where the bundles start to pay: the ad-free Disney, Hulu, and Max bundle at around 30 dollars gives three catalogs for less than Netflix and Max separately. Families with children under twelve almost always want Disney+, need three or four concurrent streams, and benefit most from the bundle plus one other service. The household that wants 4K and immersive audio for a serious television is paying for premium tiers, which pushes the cost of two services to 45 dollars or more; for them, rotation matters more than for anyone.
The shared or multigenerational household, the profile hit hardest by password-sharing rules, should look at the household definition of each service, which generally means the same internet connection, and at extra-member pricing where it exists. In many cases two separate ad-tier subscriptions in the two homes cost less than one premium subscription plus an extra-member fee, and the ad tier is the cheaper answer even for people who dislike ads. The decision tree below compresses these profiles into a starting point.
Which plan structure to start from
Which plan structure should a household start from?
-
One viewer, ads are tolerable
Two ad-supported services, rotated by season, plus free platforms
Under 20 dollars covers nearly all current programming.
-
Two adults, no ads, different tastes
The ad-free three-way bundle, or two standard tiers
Two concurrent streams on every standard tier; the bundle undercuts two separate services.
-
Children in the house
Disney bundle plus one other service
Disney+ is the children's catalog; four streams handle simultaneous viewing.
-
4K home theater
Premium tiers on one or two services, strictly rotated
Premium pricing makes holding more than two year-round expensive.
-
Two homes sharing
Separate ad-tier accounts per home
Usually cheaper than premium plus extra-member fees, and no enforcement risk.
How to read the chart in six steps, and rotation as a strategy

The chart is a tool for a decision, not a ranking, and the decision has an order. Start with the catalog, because no price is worth paying for shows you will not watch: list the three or four series or franchises that actually drive your viewing and note which service each lives on. Then decide your ad tolerance honestly, because that halves or doubles the price of everything. Then count concurrent streams you actually need, check downloads if anyone travels, and only then compare prices at the tiers that meet those requirements. Finally, look for bundles that cover the list, and for carrier or ISP inclusions you may already have.
The strategy that beats every plan on the chart is rotation. Streaming subscriptions have no contract, the services release their tentpole shows in seasons, and canceling and resubscribing takes two minutes. A household that subscribes to Max for the two months its prestige series airs, then switches to Disney+ for a season, then to Netflix, pays for one or two services at any time while watching the best of four or five over the year. The services know this, which is why they have moved toward weekly episode releases rather than full-season drops, but it remains the most effective way to cut the bill, and most people never do it because inertia is the product's strongest feature.
A practical rotation system is a shared note or calendar listing which service is active, what the household is watching on it, and the date to reassess. Annual plans, which save one to two months against monthly pricing, are the enemy of rotation and only make sense for the one service a household watches every month. Everything else should be monthly and cancelable.
How to run a household subscription audit
-
List the shows, not the servicesStep 1
Write down the three or four series, franchises, or sports that drive your viewing and where each lives.
-
Decide on ads honestlyStep 2
Ads roughly halve the price. If you have tolerated them on YouTube for years, you can tolerate four minutes an hour here.
-
Count screens and check downloadsStep 3
How many people watch at once on a typical evening? Does anyone need offline viewing? These set the tier.
-
Compare at the tier that fitsStep 4
Only now compare prices, and only at the tiers that meet steps 2 and 3. The ad tier price is irrelevant if you refuse ads.
-
Look for bundles and inclusionsStep 5
Check whether a bundle covers your list, and whether your carrier, ISP, or Prime membership already includes something.
-
Set a rotation dateStep 6
Subscribe monthly, note when the current show ends, and reassess on that date. Hold annual plans only for the one service you use every month.
What product teams should take from the chart
Read as a set of pricing experiments, the streaming market has run the largest public test of subscription structure ever conducted, and its results transfer to any subscription product. The first result is three tiers. Every service that started with one price ended up with good, better, and best, with the middle tier positioned as the default and the top tier justified by capacity (streams, quality) rather than by content. Products that sell a single plan are leaving both the price-sensitive and the price-insensitive customer unserved, and the streaming experience suggests the capacity-based premium tier is easier to sell than one gated on features.
The second result is that an ad-funded or otherwise subsidized entry tier expands the market rather than cannibalizing it, if and only if the paid tier stays clearly better. Streaming services worried for years that ads would degrade the brand and pull paying customers down; what happened is that a new population came in at the bottom, ad revenue closed most of the gap, and churn fell. The equivalent for a software product is a usage-limited free tier or a sponsored tier, with the same condition attached. The third result is bundling as churn defense: the services with the lowest churn are not the ones with the best catalog but the ones bundled into something else, and any product that can be sold alongside a complementary one should be.
The engineering behind these structures is worth a paragraph because it is where product teams underestimate the work. Tiering requires entitlement logic that gates streams, quality, downloads, and ads per account and enforces it on every client; ad tiers require an ad decisioning and insertion pipeline, frequency capping, and measurement; household enforcement requires device and network fingerprinting with an appeals path; and bundles require billing that can split revenue across partners and handle a cancellation of one part. Teams building a video or media platform or a multi-tier subscription product on top of a scalable backend should budget for the entitlement and billing layers as first-class systems, not as settings on a payment provider. The architecture diagram after this section shows the layers involved.
Subscription habits that save money, and the ones that leak it
Do this
- Tier on capacity, not just featuresStreams, seats, quality, and volume are easier for customers to understand as premium than a list of gated features.
- Make the paid tier obviously betterThe ad or free tier expands the base only if upgrading is clearly worth it; the gap has to be felt.
- Treat entitlements as a systemOne service that answers what this account may do, enforced on every client, tested like payments.
- Bundle with complementsBundled subscribers churn less. Find the product your customers already pay for and sell alongside it.
Not this
- Raise the ad-free price while hiding the ad tierCustomers notice, trust erodes, and the ad tier stops feeling like a choice.
- Enforce household rules without an appeals pathTravelers and split families are legitimate customers; blunt enforcement churns them.
- Bolt ads onto a player built for noneInsertion, capping, and measurement need to be designed in; retrofits show as buffering and repeated ads.
- Depend on annual plans for retentionAnnual pricing delays churn rather than preventing it; the product has to earn the renewal.
Conclusion: the chart changes, the method does not
By the time this chart is a year old, several prices in it will have risen, at least one bundle will have been restructured, and a service may have merged or rebranded; the market has done all three in each of the last few years. What will not change is the method: list the shows, decide about ads, count screens, compare only at the tier that fits, look for bundles, and rotate. A household that follows those six steps will pay less than one that holds whatever it signed up for in 2022, whatever the numbers become.
For product teams, the chart is a reminder that pricing structure is a product decision with public precedent. Three tiers, an entry tier that expands the base, capacity-based premium, bundling for churn defense, and the engineering to enforce it all are the pattern the world's largest subscription businesses converged on under intense competition. The pattern is available to anyone building a subscription product, and the streaming market will keep publishing the results of its experiments for anyone willing to read a comparison chart as more than a shopping aid.
- Confirm the price. Every figure here is indicative. The service's plan page, viewed as a new customer, is the only source of truth.
- Ads halve the bill. Four to five minutes an hour is the trade. Most households that try it keep it.
- Bundle only what you would buy anyway. A saving on something you do not want is not a saving.
- Rotate. No contracts, seasonal releases, and a two-minute cancel flow mean holding everything year-round is a choice, not a necessity.
Frequently asked questions
Which streaming service is the cheapest in 2026?
At the ad-supported tier, Netflix, Paramount+, and Peacock are typically the cheapest paid options at around 8 dollars a month, with Disney+, Hulu, and Max around 10. Free with ads, YouTube, Tubi, Pluto TV, the Roku Channel, and Freevee cost nothing. Among ad-free plans, Apple TV+ and Paramount+ with Showtime are usually the lowest at about 13 dollars. Prices change often; confirm on the service's plan page.
Is the ad-supported tier worth it?
For most households, yes. Paid ad tiers carry roughly four to five minutes of advertising per hour, far less than broadcast television, cost about half the ad-free price, and include nearly the full catalog. The checks are whether the ad tier includes downloads and how many concurrent streams it allows, since some services restrict both on the cheapest plan.
Which streaming bundle saves the most money?
The three-way Disney+, Hulu, and Max bundle offers the largest indicative saving against buying the parts, roughly 13 dollars a month with ads and over 20 ad-free. But a bundle only saves money if you would have subscribed to every service in it; a bundle that includes a service you never wanted is a cost, not a saving. Check carrier, internet provider, and Amazon Prime inclusions too, since many households already have a service bundled without using it.
How many people can share one streaming account?
Since 2023 most services require all users of an account to live in the same household, generally defined by the primary internet connection, and offer paid extra-member slots for people outside it. Concurrent stream limits then apply within the household: typically two on standard tiers and four on premium, with Disney+ allowing four on standard and Apple TV+ allowing six. Two separate ad-tier accounts are often cheaper than a premium plan plus an extra-member fee for two homes.
What is streaming rotation and does it work?
Rotation means subscribing to a service only for the months its shows you want are airing, then canceling and moving to another. Because streaming has no contracts and canceling takes minutes, a household can watch the best of four or five services over a year while paying for one or two at any time. It works well and is the single most effective way to cut the bill; the obstacle is inertia, which a shared note with a reassessment date solves.
What can product teams learn from streaming pricing?
Three lessons with public evidence: three tiers with the premium tier based on capacity rather than features; an ad-funded or subsidized entry tier expands the paying base rather than cannibalizing it, provided the paid tier stays clearly better; and bundling with complementary products cuts churn more than any catalog improvement. The engineering underneath, entitlements, billing with revenue splits, ad insertion, and household enforcement, needs to be planned as first-class systems.
When a subscription product needs the tiers, entitlements, and billing that the pricing page promises, AgileTech is an AI native software development company in Vietnam that builds media and subscription platforms end to end.
Source: https://agiletech.vn/blog/streaming-service-comparison-chart/ · (c) AgileTech Vietnam. Printed from agiletech.vn.